Stock Analysis · Chubb Ltd (CB)
Overview
Chubb Ltd is one of the world’s largest property and casualty insurers. In simple terms, it sells insurance policies that help individuals and businesses absorb financial losses from events such as accidents, lawsuits, natural disasters, cyber incidents, travel disruptions, and health-related claims. The group also earns investment income by investing the large pool of money it holds before claims are paid. That combination of underwriting profit and investment income is the core of how insurers like Chubb make money.
Chubb operates through a broad mix of commercial insurance, consumer insurance, accident and health products, and life insurance, with a meaningful international footprint across North America, Europe, Asia, and Latin America. Its business mix matters because it reduces dependence on any one country or product line and gives the company more ways to grow when pricing conditions are favorable.
Based on the company’s recent annual reporting structure, revenue is mainly generated from the following sources:
- Commercial Property & Casualty insurance: approximately 45% to 50% of premium revenue. This includes coverage for large and mid-sized businesses, such as property, casualty, financial lines, professional liability, cyber, marine, and specialty risks.
- Consumer Property & Casualty insurance: approximately 20% to 25%. This includes homeowners, personal auto, valuable articles, and other personal lines, often aimed at higher-income households.
- Accident & Health: approximately 15% to 20%. This covers supplemental health, personal accident, travel insurance, and similar protection products.
- Life insurance: approximately 10% to 15%. This business is more concentrated outside the United States and provides traditional life and savings-related products.
- Investment income and other insurance-related revenue: the remaining share, typically a smaller but important contributor to total earnings, especially when interest rates are supportive.
Over the last several years, Chubb’s total revenue has expanded from roughly $41 billion to nearly $60 billion, while net income has also moved higher overall despite the normal ups and downs that come with catastrophe losses and financial market effects. That pattern is consistent with a large insurer benefiting from disciplined pricing and scale.
The long-term picture shows rising revenue and improving profit generation after a weaker 2022. Expense growth has been much slower than revenue growth over the full period, which suggests operating leverage has improved as premium volume and underwriting conditions strengthened.
Key Figures
| Metric | Value | Sector ⓘ |
|---|---|---|
| Date | Nov 21, 2026 | |
| Context | ||
| Sector | Financial Services | |
| Industry | Insurance - Property & Casualty | |
| Market Cap ⓘ | $141.76B | |
| Beta ⓘ | 0.29 | |
Value (Cheapness) | ||
| P/E Ratio ⓘ | 13.17 | 12.01 |
| P/B Ratio ⓘ | 2.12 | 1.48 |
| FCF Yield ⓘ | 12.56% | 8.77% |
| Dividend Yield ⓘ | 1.06% | 3.01% |
| EBIT / EV ⓘ | 6.91% | 8.31% |
| PEG ⓘ | 2.83 | |
Growth (Business expansion) | ||
| Revenue Growth ⓘ | 0.30% | 6.70% |
| RPS Growth (5Y CAGR) ⓘ | 13.15% | 12.35% |
| EPS Growth (5Y CAGR) ⓘ | 9.94% | -0.27% |
| BVPS Growth (5Y CAGR) ⓘ | 6.11% | 4.83% |
| Margin Growth (5Y Trend) ⓘ | -2.13% | -4.16% |
| FCF Growth (5Y CAGR) ⓘ | 7.14% | 4.69% |
| DPS Growth (5Y CAGR) ⓘ | 4.68% | 8.82% |
Quality (Business durability) | ||
| ROIC (Latest) ⓘ | 10.05% | 9.49% |
| ROE (Latest) ⓘ | 16.43% | 14.02% |
| ROA (Latest) ⓘ | 4.01% | 1.53% |
| ROIC (5Y Median) ⓘ | 11.92% | 7.80% |
| ROE (5Y Median) ⓘ | 16.13% | 12.09% |
| ROA (5Y Median) ⓘ | 3.97% | 1.28% |
| Net Debt / EBIT (Latest) ⓘ | 1.41 | 0.88 |
| Net Debt / EBIT (5Y Median) ⓘ | 1.26 | 0.73 |
| Net Debt / EBITDA (Latest) ⓘ | 1.37 | 0.71 |
| Operating Margin (Latest) ⓘ | 18.38% | 23.37% |
| Operating Margin (5Y Median) ⓘ | 21.72% | 24.29% |
| Debt to Equity (Latest) ⓘ | 26.06% | 59.34% |
| Profit Margin (Latest) ⓘ | 18.13% | 26.65% |
| Free Cash Flow (Latest) ⓘ | $17.81B | |
Momentum (Price trend) | ||
| 3Y Return ⓘ | +73.20% | +73.29% |
| 12M Return (excl. last month) ⓘ | +33.45% | +18.35% |
| 6M Return ⓘ | +13.22% | +3.24% |
| Price vs. 200-Day MA ⓘ | +10.12% | +2.17% |
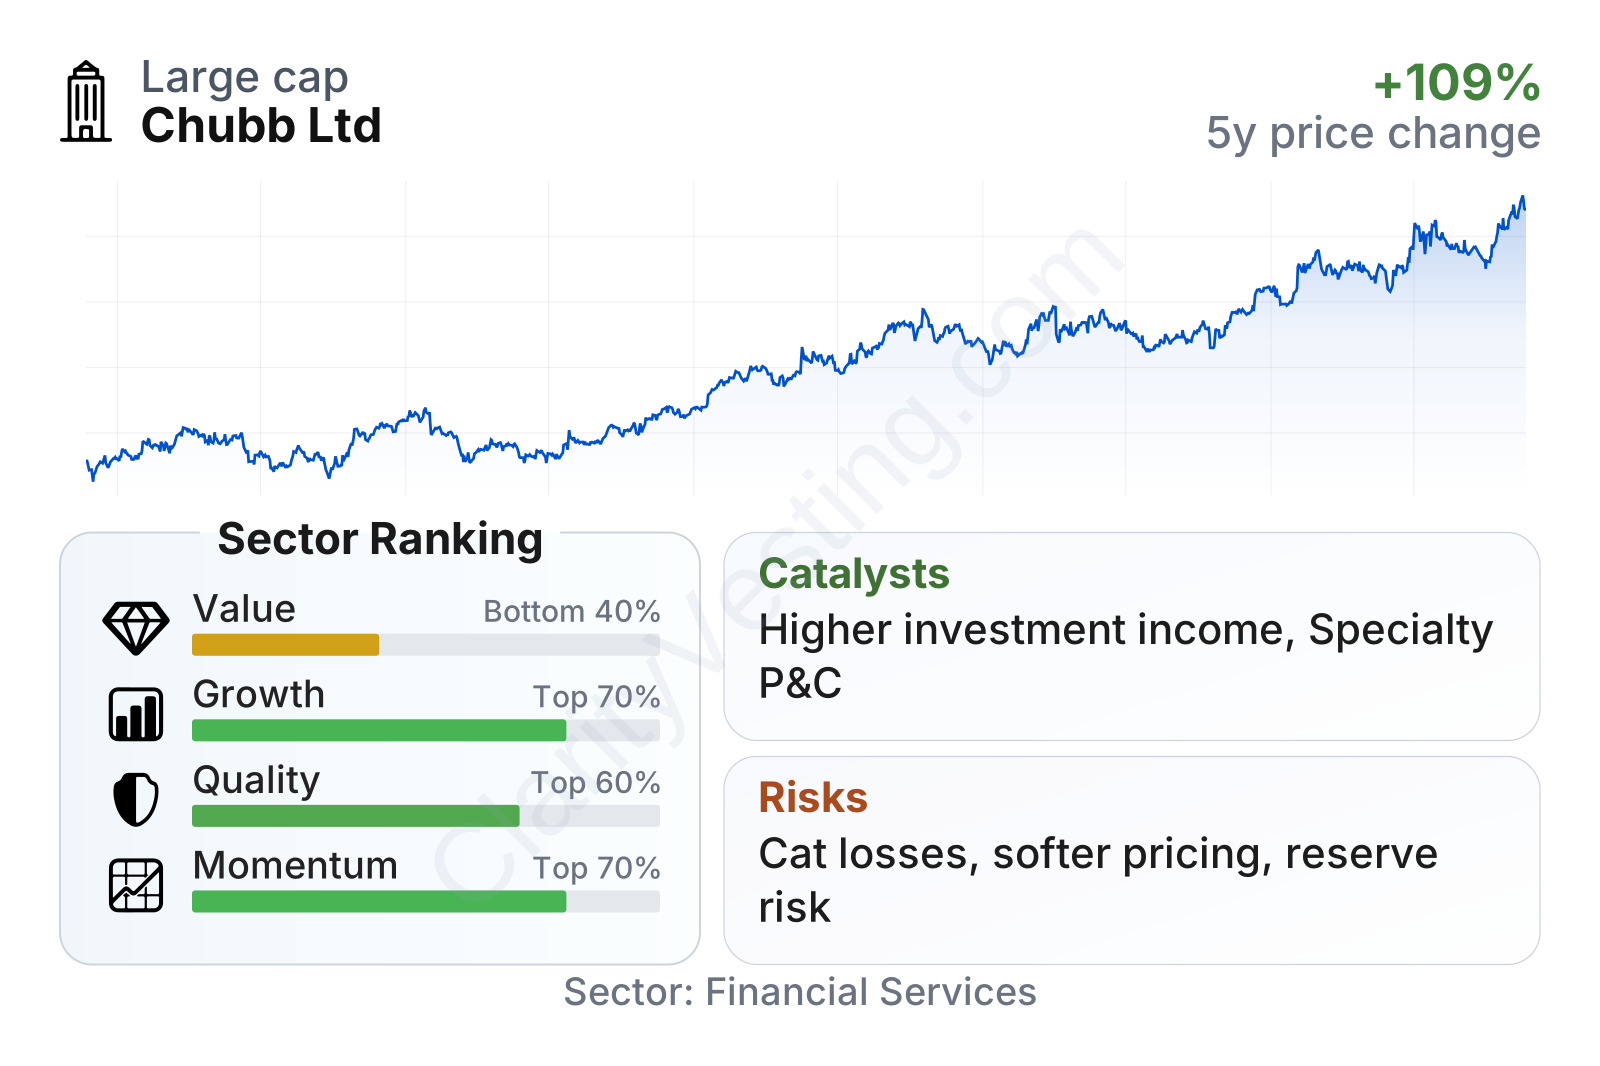
Chubb stands out as a very large insurer with unusually low share-price volatility for an equity, reflected in a beta well below 1. Its quality profile is strong: returns on equity and assets are above sector medians, and leverage looks moderate on a debt-to-equity basis. Growth is mixed in the short term, with recent revenue growth slower than the industry median, but the longer-term record remains solid, especially for earnings per share and book value per share. On valuation, the stock trades near the sector median on earnings but at a clear premium on book value, which signals that the market is assigning extra value to Chubb’s profitability, balance sheet quality, and consistency.
The stock-price trend over the last five years has been clearly upward, with a particularly strong move through 2024 and 2026. Dividend yield has compressed to around 1%, which says more about the stock’s price appreciation than about any obvious weakness in the dividend itself.
Growth
Chubb operates in a sector that tends to grow steadily over long periods rather than explosively. Insurance demand generally rises alongside economic activity, asset values, construction, business formation, and regulatory complexity. Several areas of the market also have structural tailwinds, especially cyber insurance, specialty commercial lines, high-value personal insurance, and accident and health products in underpenetrated international markets.
Chubb’s strategy is straightforward and sensible for long-term expansion: write business where pricing is attractive, keep underwriting discipline, use scale to spread risk, and deploy capital across both insurance operations and investments. That approach may sound conservative, but in insurance, consistency and risk selection often matter more than rapid expansion.
One of the more encouraging signs is the company’s multiyear earnings progression.
Earnings per share have climbed materially since 2021, showing that growth has not depended only on premium volume. It also reflects pricing strength, underwriting discipline, and support from investment income. The five-year earnings growth rate is comfortably above the sector median, which is notable in an industry where results can be volatile.
Book value per share is another useful measure for insurers because it gives a rough view of how shareholder capital is compounding over time.
After a dip in 2022, book value per share has recovered strongly and moved to new highs by 2025. That is important because insurance companies create long-term value partly by growing book value while maintaining healthy underwriting standards. Chubb’s five-year book value growth is modest rather than spectacular, but still ahead of the sector median.
A significant catalyst is the interest-rate backdrop. Insurers invest large fixed-income portfolios, and higher reinvestment yields can support stronger investment income over time. Chubb also has room to benefit from continued premium rate discipline in commercial lines and from international expansion in markets where insurance penetration is still relatively low. In addition, specialty lines such as cyber and professional liability remain attractive because they require underwriting expertise and can carry better pricing.
Recent company communications have also highlighted continued premium growth in core property and casualty operations, strong underwriting income, and sizable capital return capacity. None of that guarantees uninterrupted growth, but it does support the view that Chubb’s current strategy is still working.
Risks
This article is for informational purposes only and does not constitute financial advice. Some content is AI-generated. See Disclaimer