Stock Analysis · Cathay General Bancorp (CATY)
Overview
Cathay General Bancorp is the holding company for Cathay Bank, a regional bank focused on serving businesses, professionals, and individuals, with a particularly strong presence in Asian American communities and cross-border commercial relationships. Its branch network is concentrated in California, New York, Washington, Texas, Illinois, Maryland, Massachusetts, Nevada, and New Jersey, and it also has overseas representative presence in Asia. In simple terms, the company collects deposits, makes loans, earns interest on those loans and securities, and provides everyday banking services to commercial and consumer clients.
Like most banks, Cathay’s revenue is driven mainly by net interest income, which is the spread between what it earns on loans and investments and what it pays on deposits and other funding. Based on recent annual results and segment disclosures, the business mix can be described approximately as follows:
- Net interest income: about 80% to 90% of total revenue. This is the core engine of the bank and includes income from commercial real estate loans, commercial and industrial loans, residential mortgages, construction lending, and interest-earning securities.
- Fee-based revenue: about 10% to 20% of total revenue. This includes loan servicing and commitment fees, deposit account fees, wire transfer and trade finance fees, wealth-related services, and gains or income tied to treasury and other banking services.
Within lending, the largest exposure is typically commercial real estate, followed by commercial and industrial lending, residential mortgage lending, and construction loans. On the funding side, customer deposits are the main source used to support lending activity. That makes Cathay a fairly traditional regional bank rather than a complex financial institution.
The broader financial flow over the last few years shows a business that expanded revenue meaningfully as interest rates rose, but also saw funding costs climb sharply. Even so, profitability has remained solid, with net income staying comfortably positive through this cycle.
Key Figures
| Metric | Value | Sector ⓘ |
|---|---|---|
| Date | Oct 24, 2026 | |
| Context | ||
| Sector | Financial Services | |
| Industry | Banks - Regional | |
| Market Cap ⓘ | $4.04B | |
| Beta ⓘ | 0.88 | |
Value (Cheapness) | ||
| P/E Ratio ⓘ | 11.84 | 12.46 |
| P/B Ratio ⓘ | 1.40 | 1.25 |
| FCF Yield ⓘ | 13.20% | 9.82% |
| Dividend Yield ⓘ | N/A | 2.94% |
| EBIT / EV ⓘ | N/A | 8.11% |
| PEG ⓘ | 1.33 | |
Growth (Business expansion) | ||
| Revenue Growth ⓘ | 13.80% | 9.10% |
| RPS Growth (5Y CAGR) ⓘ | 22.05% | 12.31% |
| EPS Growth (5Y CAGR) ⓘ | -4.45% | -6.97% |
| BVPS Growth (5Y CAGR) ⓘ | 8.42% | 5.02% |
| Margin Growth (5Y Trend) ⓘ | -23.53% | -4.00% |
| FCF Growth (5Y CAGR) ⓘ | 2.41% | 4.71% |
| DPS Growth (5Y CAGR) ⓘ | 2.21% | 8.92% |
Quality (Business durability) | ||
| ROIC (Latest) ⓘ | N/A | 9.18% |
| ROE (Latest) ⓘ | 12.20% | 13.93% |
| ROA (Latest) ⓘ | 1.46% | 1.57% |
| ROIC (5Y Median) ⓘ | 17.54% | 7.80% |
| ROE (5Y Median) ⓘ | 12.26% | 12.15% |
| ROA (5Y Median) ⓘ | 1.49% | 1.28% |
| Net Debt / EBIT (Latest) ⓘ | N/A | 1.02 |
| Net Debt / EBIT (5Y Median) ⓘ | 0.22 | 0.72 |
| Net Debt / EBITDA (Latest) ⓘ | -0.17 | 0.88 |
| Operating Margin (Latest) ⓘ | N/A | 22.30% |
| Operating Margin (5Y Median) ⓘ | 30.80% | 24.50% |
| Debt to Equity (Latest) ⓘ | 2.13% | 59.34% |
| Profit Margin (Latest) ⓘ | 43.67% | 26.42% |
| Free Cash Flow (Latest) ⓘ | $534.03M | |
Momentum (Price trend) | ||
| 3Y Return ⓘ | +111.20% | +95.73% |
| 12M Return (excl. last month) ⓘ | +27.43% | +17.30% |
| 6M Return ⓘ | +20.99% | +6.07% |
| Price vs. 200-Day MA ⓘ | +13.68% | +5.36% |
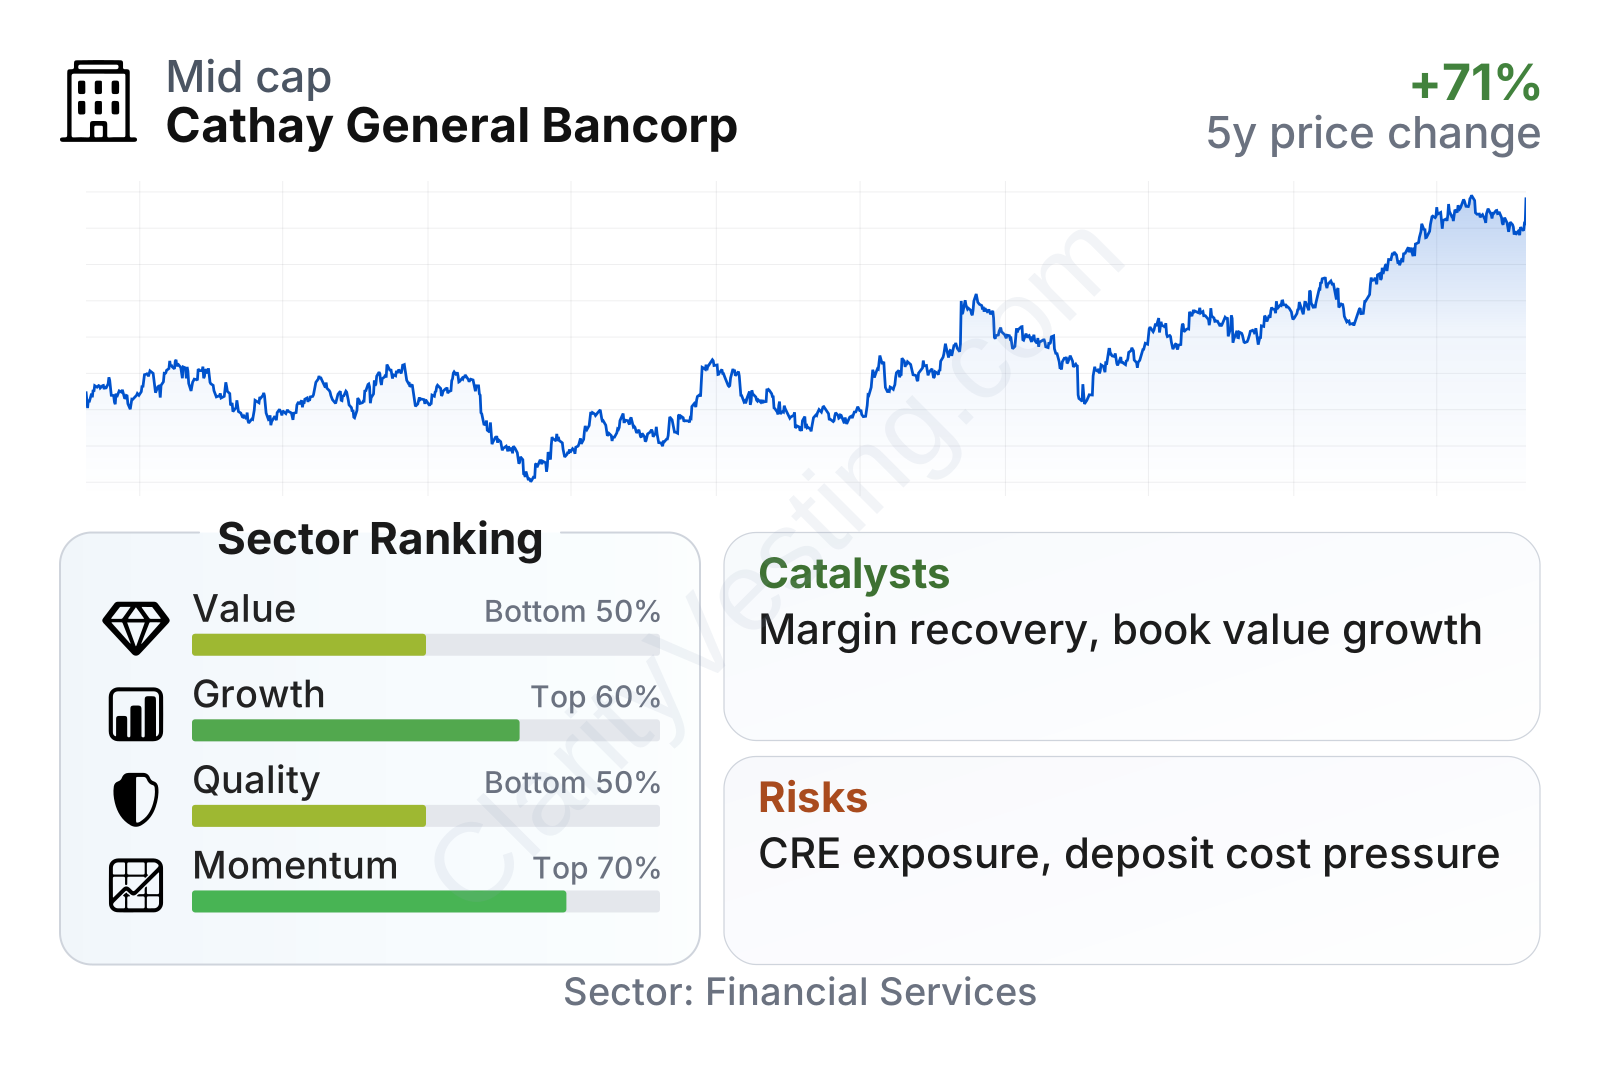
Cathay is a mid-sized regional bank with relatively low share-price volatility, as reflected by a beta below 1. The factor breakdown is mixed. Valuation is not especially discounted versus peers on book value, while earnings multiples look close to the regional bank range. Growth signals are uneven: revenue expansion has been healthy, but earnings growth over five years has been weaker because margins came under pressure during the deposit repricing cycle. Quality metrics are also mixed, with strong profit margin and conservative leverage standing out more positively than current return ratios. Momentum has been one of the brighter areas, with the stock outperforming the sector median over the last 6 to 12 months.
The share-price history also reflects this pattern. The stock dropped during the 2023 regional banking stress, then recovered steadily and recently moved to a noticeably higher level than in 2021. That suggests the market has become more comfortable with the bank’s balance sheet and earnings resilience, although the recovery has also narrowed part of the earlier valuation discount.
Growth
Regional banking is not a high-growth sector in the same way as software or semiconductors, but it remains a necessary part of the economy. Over the long run, banks like Cathay tend to grow through a combination of loan growth, deposit gathering, fee income expansion, and disciplined capital allocation. Cathay’s niche focus matters here: it has a long-established franchise in serving middle-market businesses and customers tied to Asian American communities and Pacific Rim commercial activity. That customer specialization can support relationship banking, repeat business, and lower churn than a more generic branch model.
Cathay’s strategy for future growth appears sensible rather than aggressive. The bank has historically emphasized credit discipline, capital strength, and targeted commercial banking rather than rapid expansion at any cost. For a lender, that can be an advantage over a full cycle. The strongest practical catalyst is a more favorable interest-rate and funding environment. If deposit costs stabilize or fall faster than asset yields, net interest margin can improve, which would lift earnings without requiring outsized balance-sheet growth.
Earnings per share show this cyclicality clearly. Results improved strongly from 2021 through 2023, dipped in 2024 as funding costs rose, and then began to recover. That pattern is important for long-term readers: Cathay’s earnings power did not disappear, but it is sensitive to the banking rate cycle.
Book value per share has moved upward steadily over the last several years, which is usually one of the cleaner ways to judge value creation for a bank. Even when earnings growth has been uneven, the continued rise in book value suggests the company has kept adding capital and retaining underlying franchise value.
Another useful catalyst is the bank’s continued exposure to commercial clients and trade-linked business in large coastal markets, especially California. If business formation, commercial real estate activity, and cross-border business flows remain resilient, Cathay has room to keep growing loans and fee-generating services inside its existing footprint. Recent company communications have also pointed to ongoing balance-sheet management and capital return, which can support per-share progress even in a moderate-growth environment.
Risks
This article is for informational purposes only and does not constitute financial advice. Some content is AI-generated. See Disclaimer


