Stock Analysis · Caterpillar Inc (CAT)
Overview
Caterpillar Inc. is one of the world’s largest manufacturers of heavy equipment used in construction, mining, energy, transportation, and industrial projects. Its machines include excavators, loaders, bulldozers, haul trucks, engines, turbines, and related parts. The company also provides services such as maintenance, digital fleet tools, and financing. In simple terms, Caterpillar helps customers build roads and buildings, extract minerals, move materials, generate power, and keep large fleets operating.
The business is organized into three main operating segments, plus a financing arm. Based on the latest annual reporting structure, revenue is mainly generated from the sale of machinery, engines, components, replacement parts, and financial products.
- Construction Industries: about 40% of total sales and revenues. This segment includes equipment used in general construction, roadbuilding, quarry and aggregates work, and related services.
- Resource Industries: about 20%. This covers mining trucks, large excavators, loaders, and machines used in mining and heavy quarry operations.
- Energy & Transportation: about 35%. This segment sells engines, turbines, locomotives, and power systems used in oil and gas, marine, electric power, industrial, and transportation markets.
- Financial Products: about 5%. This unit provides equipment financing, leasing, insurance, and related support that helps customers acquire Caterpillar equipment.
A useful feature of Caterpillar’s model is that it does not depend only on new equipment sales. A meaningful share of business comes from higher-margin parts and services tied to its large installed base of machines already working around the world. That makes the company more resilient than a pure one-time equipment seller, even though its end markets remain cyclical.
Over the last several years, the business mix has also shown strong profit conversion. Revenue moved from roughly $51 billion in 2021 to about $68 billion in 2025, while net income rose from about $6.5 billion to nearly $8.9 billion despite some margin pressure in 2025. This points to better pricing, operating discipline, and the benefit of scale.
The long-term pattern is encouraging: sales expanded materially from 2021 to 2025, gross profit improved even faster through 2024, and profitability stayed well above earlier-cycle levels. The softer 2025 earnings profile appears more like margin normalization than a breakdown in the business model.
Key Figures
| Metric | Value | Sector ⓘ |
|---|---|---|
| Date | Oct 24, 2026 | |
| Context | ||
| Sector | Industrials | |
| Industry | Farm & Heavy Construction Machinery | |
| Market Cap ⓘ | $333.37B | |
| Beta ⓘ | 1.58 | |
Value (Cheapness) | ||
| P/E Ratio ⓘ | 31.22 | 22.29 |
| P/B Ratio ⓘ | 17.65 | 1.98 |
| FCF Yield ⓘ | 2.70% | 6.26% |
| Dividend Yield ⓘ | 0.85% | 1.92% |
| EBIT / EV ⓘ | 3.65% | 4.83% |
| PEG ⓘ | 1.42 | |
Growth (Business expansion) | ||
| Revenue Growth ⓘ | 24.00% | 9.30% |
| RPS Growth (5Y CAGR) ⓘ | 11.59% | 7.76% |
| EPS Growth (5Y CAGR) ⓘ | -0.31% | -13.17% |
| BVPS Growth (5Y CAGR) ⓘ | 10.90% | 6.13% |
| Margin Growth (5Y Trend) ⓘ | 1.58% | 0.74% |
| FCF Growth (5Y CAGR) ⓘ | 12.06% | 10.79% |
| DPS Growth (5Y CAGR) ⓘ | 8.36% | 9.41% |
Quality (Business durability) | ||
| ROIC (Latest) ⓘ | 18.30% | 10.75% |
| ROA (Latest) ⓘ | 11.04% | 5.41% |
| ROIC (5Y Median) ⓘ | 16.54% | 9.37% |
| ROA (5Y Median) ⓘ | 9.52% | 4.95% |
| Net Debt / EBIT (Latest) ⓘ | 2.56 | 2.04 |
| Net Debt / EBIT (5Y Median) ⓘ | 2.65 | 2.27 |
| Net Debt / EBITDA (Latest) ⓘ | 2.21 | 1.39 |
| Net Debt / Assets ⓘ | 37.46% | 19.27% |
| EBITDA / Interest ⓘ | 15.92 | 9.58 |
| Operating Margin (Latest) ⓘ | 20.10% | 10.49% |
| Operating Margin (5Y Median) ⓘ | 18.63% | 10.30% |
| Debt to Equity (Latest) ⓘ | 232.77% | 64.82% |
| Profit Margin (Latest) ⓘ | 14.51% | 6.67% |
| Free Cash Flow (Latest) ⓘ | $8.99B | |
Momentum (Price trend) | ||
| 3Y Return ⓘ | +208.28% | +67.77% |
| 12M Return (excl. last month) ⓘ | +76.59% | +12.05% |
| 6M Return ⓘ | -7.35% | 0.00% |
| Price vs. 200-Day MA ⓘ | -8.19% | +0.67% |
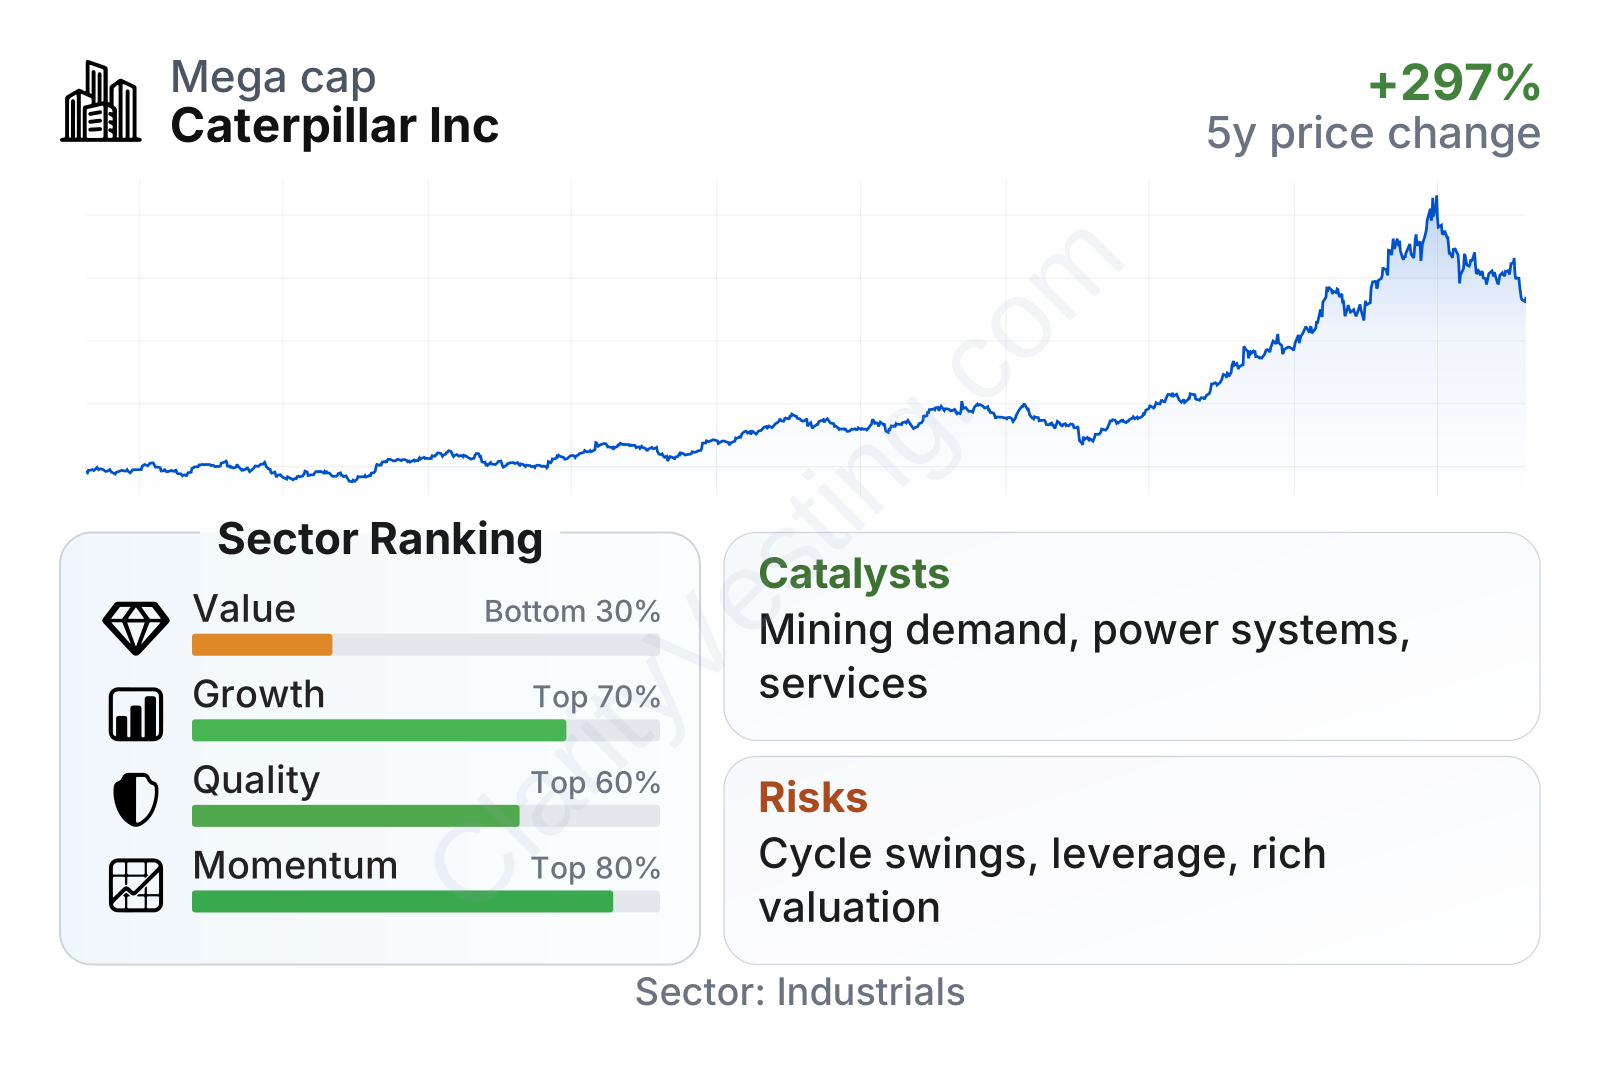
Caterpillar is a very large industrial company with above-average share-price volatility, reflected in a beta around 1.6. The factor profile is mixed in an understandable way: value metrics look expensive versus the sector, while quality, growth, and especially momentum are much stronger. Profitability stands out, with returns on capital and operating margin clearly ahead of sector medians. Free cash flow remains substantial in absolute dollars, but the stock’s strong price run has reduced the cash flow yield and dividend yield relative to many industrial peers.
The stock chart highlights just how powerful the market’s re-rating has been. The share price has climbed severalfold since late 2021, especially during 2025 and 2026. That kind of move usually means the market is pricing in a combination of durable earnings power, strong end-market confidence, and greater willingness to pay for quality.
Growth
Caterpillar operates in markets that should remain important for many years: infrastructure, mining, energy systems, grid support, and industrial equipment replacement. These are not fast-changing consumer categories, but they are essential parts of the real economy. Several structural trends support demand, including electrification-related mining, energy security, data-center and power infrastructure needs, and public works spending in major economies.
The company’s strategy is also sensible for long-duration growth because it goes beyond selling machines. Management has spent years building a broader services business around parts, maintenance, connected equipment, autonomy, and analytics. That matters because services can deepen customer relationships and usually carry better economics than first-time equipment sales. Caterpillar’s large global dealer network further reinforces this model by keeping machines supported locally and reducing downtime for customers.
Recent revenue growth has been cyclical rather than linear. Growth was very strong in 2021 through 2023, turned negative during much of 2024 and early 2025, and then accelerated again into late 2025 and mid-2026, with year-over-year growth back above 20%. That pattern fits the nature of heavy equipment markets: orders can slow for a period and then recover sharply when commodity demand, infrastructure activity, or fleet replacement improves.
Cash generation supports the growth case. Free cash flow climbed sharply from 2022 to 2024 and has remained solid, even after coming off its peak. A business that can still produce roughly $8 billion to $10 billion of annual free cash flow through changing market conditions has meaningful flexibility for dividends, share repurchases, debt service, and investment in technology.
There are also specific catalysts worth watching. Higher demand for copper and other energy-transition minerals can support mining equipment orders. Continued grid investment and distributed power needs can help engines and power systems. In addition, Caterpillar has been pushing digital capabilities, autonomous mining solutions, and service growth, which can raise recurring revenue per machine over time rather than relying only on unit volumes.
Risks
This article is for informational purposes only and does not constitute financial advice. Some content is AI-generated. See Disclaimer