Stock Analysis · Caris Life Sciences Inc (CAI)
Overview
Caris Life Sciences is a precision medicine company focused on cancer care. In simple terms, it analyzes tumor samples and blood-based specimens to help doctors and drug developers understand the biology of a patient’s cancer. Its platform combines molecular testing, large-scale genomic and transcriptomic analysis, and artificial-intelligence-driven data tools intended to support treatment decisions, clinical trial matching, and biopharma research.
The business sits between diagnostics and life sciences services. On one side, Caris works with oncologists and health systems that order tests for patients. On the other, it works with pharmaceutical and biotechnology companies that use Caris data and testing capabilities in drug development and biomarker research. That dual exposure matters because it gives the company access to both clinical testing demand and research spending from drug developers.
Based on recent company reporting, revenue appears to come mainly from the following areas:
- Clinical oncology testing: approximately 55% to 70% of revenue. This includes tissue-based comprehensive molecular profiling and related services ordered for cancer patients.
- Biopharma and data-driven services: approximately 30% to 45% of revenue. This includes partnerships with drug developers, research support, biomarker programs, and use of Caris’s molecular and clinical database.
- Other revenue: a small residual share. This can include ancillary laboratory and service activities, but public disclosure does not always break it out in detail.
The broad financial flow shows a company that has scaled revenue rapidly over the last few years, while also carrying high operating costs tied to commercialization, research, and infrastructure. A notable improvement is that gross profit expanded much faster than revenue between 2024 and 2025, suggesting a better mix, stronger operating leverage at the gross margin line, or both. Even so, overhead and interest expense still weigh on bottom-line results.
Key Figures
| Metric | Value | Sector ⓘ |
|---|---|---|
| Date | Oct 24, 2026 | |
| Context | ||
| Sector | Healthcare | |
| Industry | Biotechnology | |
| Market Cap ⓘ | $9.14B | |
| Beta ⓘ | N/A | |
Value (Cheapness) | ||
| P/E Ratio ⓘ | 19.14 | 25.42 |
| P/B Ratio ⓘ | 15.16 | 3.08 |
| FCF Yield ⓘ | 1.60% | 3.12% |
| Dividend Yield ⓘ | N/A | 1.85% |
| EBIT / EV ⓘ | 1.77% | 0.56% |
| PEG ⓘ | N/A | |
Growth (Business expansion) | ||
| Revenue Growth ⓘ | 45.40% | 7.50% |
| RPS Growth (5Y CAGR) ⓘ | -29.76% | 8.60% |
| EPS Growth (5Y CAGR) ⓘ | N/A | -17.73% |
| BVPS Growth (5Y CAGR) ⓘ | -44.88% | 3.72% |
| Margin Growth (5Y Trend) ⓘ | N/A | -0.57% |
| FCF Growth (5Y CAGR) ⓘ | N/A | 0.96% |
| DPS Growth (5Y CAGR) ⓘ | 26.14% | 6.69% |
Quality (Business durability) | ||
| ROIC (Latest) ⓘ | 12.57% | 3.17% |
| ROA (Latest) ⓘ | 9.50% | 2.98% |
| ROIC (5Y Median) ⓘ | N/A | 4.56% |
| ROA (5Y Median) ⓘ | -60.41% | 1.87% |
| Net Debt / EBIT (Latest) ⓘ | -1.57 | 1.34 |
| Net Debt / EBIT (5Y Median) ⓘ | N/A | 1.86 |
| Net Debt / EBITDA (Latest) ⓘ | -1.38 | 1.00 |
| Net Debt / Assets ⓘ | -19.40% | 5.06% |
| EBITDA / Interest ⓘ | 3.68 | 9.55 |
| Operating Margin (Latest) ⓘ | 15.35% | 9.25% |
| Operating Margin (5Y Median) ⓘ | -56.24% | 7.33% |
| Debt to Equity (Latest) ⓘ | 76.45% | 26.68% |
| Profit Margin (Latest) ⓘ | 10.62% | 3.34% |
| Free Cash Flow (Latest) ⓘ | $146.49M | |
Momentum (Price trend) | ||
| 3Y Return ⓘ | N/A | +51.61% |
| 12M Return (excl. last month) ⓘ | -4.46% | +19.90% |
| 6M Return ⓘ | +54.68% | +10.10% |
| Price vs. 200-Day MA ⓘ | +48.35% | +6.44% |
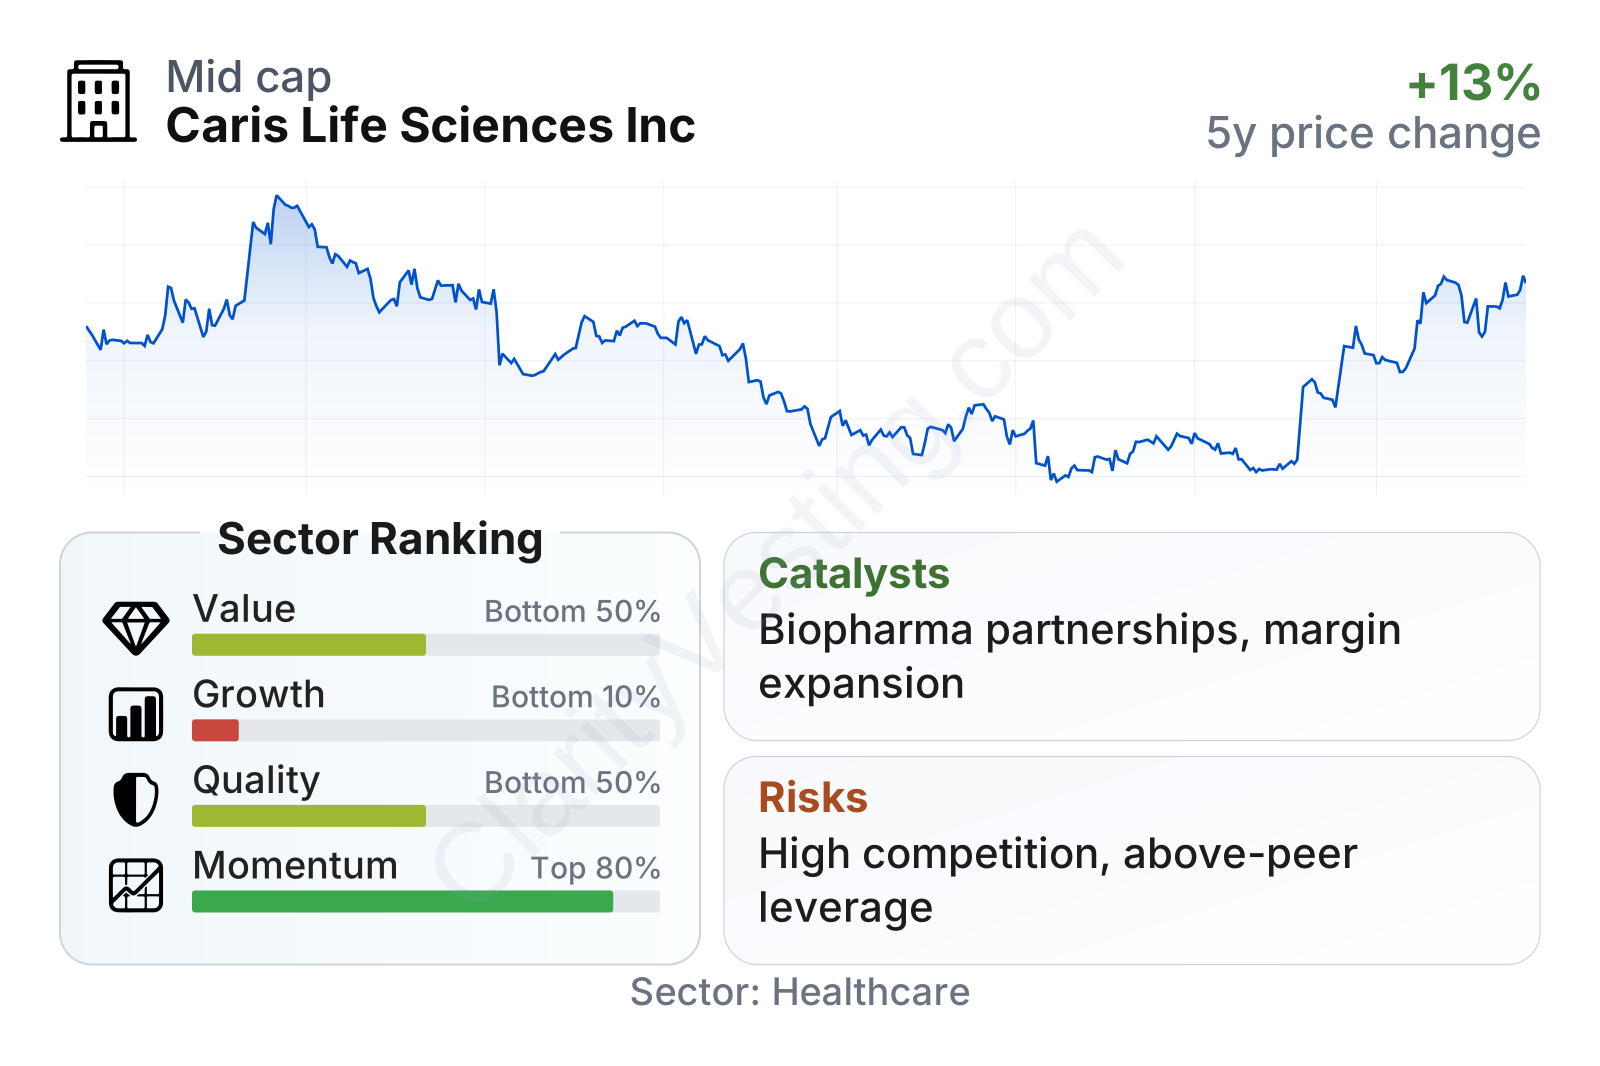
Caris is now a large-cap healthcare company by market value, but its operating profile still looks more transitional than mature. The strongest readings are in profitability relative to many biotechnology peers, with current operating and profit margins above the sector median, and returns on capital that also compare favorably. By contrast, the company ranks weakly on traditional value measures and long-term growth consistency, which reflects the tension between recent improvement and a still-uneven multi-year record. Share-price behavior has also been volatile: the stock sold off sharply over the past year before rebounding strongly in recent months, a sign that the market is still reassessing how sustainable the improvement really is.
Growth
Caris operates in a part of healthcare that still has meaningful structural growth behind it. Precision oncology continues to expand as cancer treatment becomes more biomarker-driven, more therapies require testing support, and pharmaceutical companies increasingly rely on molecular data to identify patients and design trials. This is not a niche trend anymore; it is becoming more embedded in standard oncology practice and drug development workflows.
The company’s strategy is logical for that environment. Instead of relying only on one diagnostic product, Caris has built a broader platform that connects testing, data, and biopharma services. That can create recurring commercial opportunities: a larger testing footprint can enrich the database, a stronger database can attract biopharma partners, and biopharma relationships can reinforce the relevance of the testing platform. If that loop keeps strengthening, it can support growth beyond simple test-volume expansion.
Recent revenue growth has been very strong, with year-over-year gains running far above the healthcare sector median. The pace moderated from an exceptionally high level earlier in 2026, but it still points to a business expanding much faster than most peers. That is encouraging, although the weak five-year revenue-per-share trend in the metrics table shows why the market remains cautious: the company needs to prove that this stronger phase is durable and not just a short burst after a period of heavier investment and corporate restructuring.
Cash generation has also improved. Trailing free cash flow moved higher into early 2026, which is important because many growth-stage healthcare businesses can increase sales without translating that progress into cash. For Caris, positive free cash flow provides evidence that scale may finally be helping the economics of the model. If sustained, that would be one of the most important shifts in the investment case.
A meaningful catalyst is the company’s positioning around comprehensive molecular profiling and large real-world oncology datasets. Drug developers increasingly want partners that can support biomarker discovery, patient stratification, and trial enrollment at scale. Caris has been expanding those capabilities for years, and that makes it relevant not only as a testing company but also as an infrastructure provider for oncology research. Recent company updates around partnerships, product expansion, and commercialization efforts suggest management is trying to deepen that role rather than remain a pure lab-testing vendor.
Risks
This article is for informational purposes only and does not constitute financial advice. Some content is AI-generated. See Disclaimer


