Stock Analysis · Evolution Mining Ltd (CAHPF)
Overview
Evolution Mining Ltd is an Australian gold mining company with additional exposure to copper. Its business is straightforward: it develops, operates, and optimizes mining assets, then sells the gold and copper produced from those mines. For long-term readers, the main point is that Evolution is tied first to the economics of gold, and second to how efficiently it can run a portfolio of large, long-life mining operations.
The company’s operating base is centered in Australia, with one important Canadian asset: Red Lake in Ontario. Its current producing mines include Cowal, Ernest Henry, Mungari, Northparkes, Red Lake, and Mt Rawdon, while the company is also advancing the large Cowal underground expansion. This mix matters because it gives Evolution both mature producing assets and projects that can extend mine life and lift future output.
Revenue is mostly generated by metal sales, led by gold. Based on the company’s recent reporting mix, the main sources of revenue are approximately:
- Gold sales: about 75% to 85% — the core business, produced across Evolution’s Australian mines and Red Lake in Canada.
- Copper sales: about 15% to 25% — mainly linked to assets such as Ernest Henry and Northparkes, where copper acts as an important second earnings stream.
- Silver and other by-products: low single-source contribution without a clearly disclosed standalone share — these typically support mine economics but are not the main driver of group revenue.
This revenue mix is useful because it shows Evolution is not a pure one-metal company. Gold remains the foundation, but copper provides diversification and can strengthen cash generation when industrial metal demand is favorable.
Over the last few years, the business has also become much larger in earnings terms. Revenue, operating income, and net income have all expanded sharply, while financing costs have become less burdensome relative to profit. That combination points to a miner benefiting not only from stronger commodity pricing, but also from better operating leverage.
The financial profile has improved meaningfully since 2023. Revenue has climbed strongly, while operating profit and net income have risen even faster, suggesting that higher metal prices and stronger mine performance are flowing through efficiently rather than being absorbed by overhead.
Key Figures
| Metric | Value | Sector ⓘ |
|---|---|---|
| Date | Oct 24, 2026 | |
| Context | ||
| Sector | Basic Materials | |
| Industry | Gold | |
| Market Cap ⓘ | $17.46B | |
| Beta ⓘ | 1.62 | |
Value (Cheapness) | ||
| P/E Ratio ⓘ | 17.43 | 16.92 |
| P/B Ratio ⓘ | 2.98 | 1.66 |
| FCF Yield ⓘ | 12.72% | 5.83% |
| Dividend Yield ⓘ | 4.80% | 2.07% |
| EBIT / EV ⓘ | N/A | 6.38% |
| PEG ⓘ | 0.45 | |
Growth (Business expansion) | ||
| Revenue Growth ⓘ | 19.20% | 11.25% |
| RPS Growth (5Y CAGR) ⓘ | 24.76% | 4.49% |
| EPS Growth (5Y CAGR) ⓘ | 17.96% | -15.24% |
| BVPS Growth (5Y CAGR) ⓘ | 12.68% | 5.49% |
| Margin Growth (5Y Trend) ⓘ | 19.88% | -1.54% |
| FCF Growth (5Y CAGR) ⓘ | 90.95% | 0.37% |
| DPS Growth (5Y CAGR) ⓘ | 33.36% | 5.91% |
Quality (Business durability) | ||
| ROIC (Latest) ⓘ | N/A | 9.59% |
| ROA (Latest) ⓘ | 24.38% | 4.92% |
| ROIC (5Y Median) ⓘ | 9.46% | 7.91% |
| ROA (5Y Median) ⓘ | 6.11% | 3.92% |
| Net Debt / EBIT (Latest) ⓘ | N/A | 1.36 |
| Net Debt / EBIT (5Y Median) ⓘ | 2.12 | 1.69 |
| Net Debt / EBITDA (Latest) ⓘ | 0.01 | 0.93 |
| Net Debt / Assets ⓘ | 0.65% | 13.69% |
| EBITDA / Interest ⓘ | 19.29 | 12.38 |
| Operating Margin (Latest) ⓘ | N/A | 13.24% |
| Operating Margin (5Y Median) ⓘ | 23.06% | 11.82% |
| Debt to Equity (Latest) ⓘ | 24.30% | 40.30% |
| Profit Margin (Latest) ⓘ | 26.54% | 6.38% |
| Free Cash Flow (Latest) ⓘ | $2.22B | |
Momentum (Price trend) | ||
| 3Y Return ⓘ | +322.42% | +73.47% |
| 12M Return (excl. last month) ⓘ | +54.35% | +27.59% |
| 6M Return ⓘ | -11.54% | -4.02% |
| Price vs. 200-Day MA ⓘ | -4.52% | -0.65% |
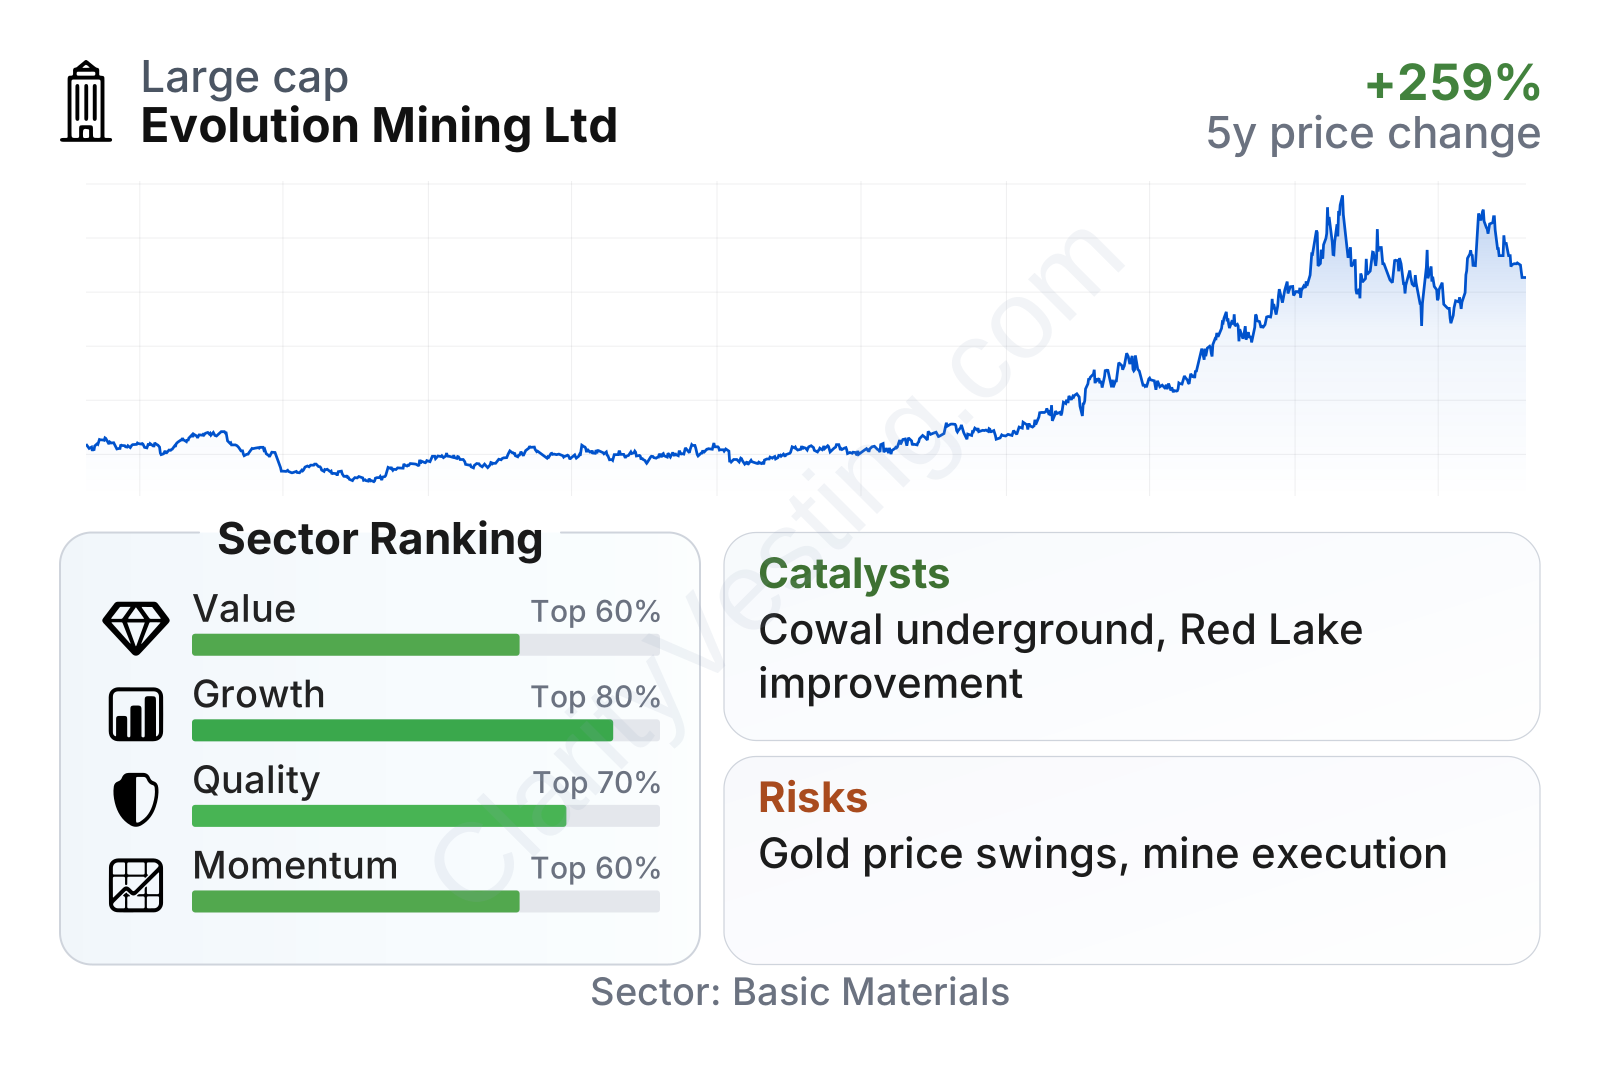
Evolution stands out as a large gold producer with above-average growth and momentum within its sector. The quality profile is solid rather than exceptional across every metric, but balance sheet strength is clearly a plus: debt levels are low compared with assets and earnings, and interest coverage is strong. The value picture is mixed. Traditional multiples such as earnings and book value are not especially cheap versus the sector median, yet free cash flow yield, dividend yield, and growth-adjusted valuation look more favorable than those headline ratios suggest.
The share price trend has been very strong over the past three years, especially from late 2024 through mid-2026. That reflects a market that has increasingly recognized the company’s stronger earnings and cash flow base, though it also means expectations are no longer low.
Growth
Evolution operates in a sector with durable long-term relevance, but it is not a conventional growth industry in the same way as software or digital services. Gold demand is supported by jewelry, investment demand, central bank purchases, and its role as a store of value during inflation or macro uncertainty. Copper adds another layer of relevance because it is closely tied to electrification, grid upgrades, and broader industrial activity. That combination gives Evolution exposure to two metals with different demand drivers.
The company’s strategy makes sense for future growth because it is built around long-life assets in relatively stable mining jurisdictions, expansion of existing operations, and selective improvement of underperforming mines. The Cowal underground project is particularly important because it can extend the life of one of Evolution’s flagship assets and support higher-value production over time. Red Lake also remains a meaningful operational turnaround opportunity: if productivity and costs continue improving, it could contribute more materially than it has historically.
Recent growth has been strong enough to place Evolution near the upper end of the sector. Year-over-year revenue growth has clearly outpaced the sector median, and the longer five-year record for revenue per share and earnings per share is also notably stronger than many peers. This matters because miners often show volatile results from one year to the next, but Evolution’s medium-term trend suggests more than just a temporary price-driven spike.
Cash generation is another important growth signal. Free cash flow has risen sharply, and the current annualized level is substantial for a company of this size. Strong free cash flow gives management more room to fund mine development, reduce debt, maintain dividends, or pursue selective acquisitions without stretching the balance sheet.
A major catalyst in the current environment is the gold price itself. When gold prices stay elevated, miners with operating discipline can see a disproportionate improvement in margins and cash flow because many costs do not rise as fast as revenue. Evolution appears to be in that favorable zone today. On top of that, any continued operational improvement at Red Lake, steady delivery at Cowal underground, or higher copper output from its base-metal-linked operations could provide additional lift beyond the gold backdrop alone.
Recent company updates have also pointed to continued progress in production and financial performance rather than balance-sheet repair or crisis management. That distinction is important: some miners spend favorable commodity cycles fixing past problems, while Evolution currently looks more focused on converting strong market conditions into operating and financial gains.
Risks
This article is for informational purposes only and does not constitute financial advice. Some content is AI-generated. See Disclaimer


