Stock Analysis · Cardinal Health Inc (CAH)
Overview
Cardinal Health is one of the largest healthcare distribution companies in the United States. Its core role is simple to understand: it helps move medicines, medical supplies, and related products from manufacturers to hospitals, pharmacies, surgery centers, laboratories, and other care providers. That distribution function may sound unglamorous, but it is essential. Healthcare systems need dependable logistics, inventory management, compliance support, and steady product availability, and Cardinal Health sits in the middle of that network.
The company reports two main operating segments, with Pharmaceutical and Specialty Solutions clearly dominating revenue. The second segment, Global Medical Products and Distribution, is smaller by sales but still strategically important because it expands Cardinal Health’s reach beyond drug distribution into medical supplies and products used across care settings.
Main sources of revenue are approximately:
- Pharmaceutical and Specialty Solutions: about 90% to 92% of total revenue. This includes branded and generic pharmaceuticals, specialty drugs, nuclear and precision health offerings, and services for pharmacies, hospitals, and physician practices.
- Global Medical Products and Distribution: about 8% to 10% of total revenue. This includes Cardinal Health-branded medical products, gloves, gowns, syringes, and broad distribution of medical and laboratory supplies to hospitals and other providers.
That mix also explains a key feature of the business: very high revenue with very thin margins. Distribution companies handle enormous volumes, but only keep a small percentage of each dollar as profit. For Cardinal Health, scale, operational discipline, and customer relationships matter more than flashy pricing power.
Over the last several years, the business has also become more profitable after a weaker period. Revenue rose from roughly $181 billion in fiscal 2022 to about $254 billion in fiscal 2026, while operating income and net income improved much more sharply than sales. That suggests better execution and a healthier earnings base, even though the economics of the business remain structurally low-margin.
The business model is easier to appreciate when looking at the flow of revenue: most sales are passed through as product cost, but gross profit has expanded over time and operating income has recovered strongly from fiscal 2022 lows. The improvement in profit dollars matters more here than margin percentages alone, because small margin changes can have a large effect on earnings at this scale.
Key Figures
| Metric | Value | Sector ⓘ |
|---|---|---|
| Date | Oct 10, 2026 | |
| Context | ||
| Sector | Healthcare | |
| Industry | Medical Distribution | |
| Market Cap ⓘ | $53.76B | |
| Beta ⓘ | 0.50 | |
Value (Cheapness) | ||
| P/E Ratio ⓘ | 32.29 | 24.79 |
| P/B Ratio ⓘ | N/A | 2.97 |
| FCF Yield ⓘ | 8.42% | 3.11% |
| Dividend Yield ⓘ | 0.88% | 2.04% |
| EBIT / EV ⓘ | 4.56% | 0.57% |
| PEG ⓘ | 1.11 | |
Growth (Business expansion) | ||
| Revenue Growth ⓘ | 5.80% | 7.35% |
| RPS Growth (5Y CAGR) ⓘ | 13.35% | 8.61% |
| EPS Growth (5Y CAGR) ⓘ | 22.14% | -18.43% |
| BVPS Growth (5Y CAGR) ⓘ | N/A | 3.94% |
| Margin Growth (5Y Trend) ⓘ | 1.34% | -0.61% |
| FCF Growth (5Y CAGR) ⓘ | 13.41% | 0.88% |
| DPS Growth (5Y CAGR) ⓘ | 0.84% | 6.74% |
Quality (Business durability) | ||
| ROIC (Latest) ⓘ | 32.51% | 3.34% |
| ROA (Latest) ⓘ | 3.05% | 2.95% |
| ROIC (5Y Median) ⓘ | 27.03% | 4.60% |
| ROA (5Y Median) ⓘ | 1.93% | 1.89% |
| Net Debt / EBIT (Latest) ⓘ | 2.02 | 1.36 |
| Net Debt / EBIT (5Y Median) ⓘ | 1.75 | 1.86 |
| Net Debt / EBITDA (Latest) ⓘ | 1.46 | 1.02 |
| Net Debt / Assets ⓘ | 8.89% | 5.85% |
| EBITDA / Interest ⓘ | 9.99 | 9.60 |
| Operating Margin (Latest) ⓘ | 0.99% | 9.19% |
| Operating Margin (5Y Median) ⓘ | 0.55% | 7.53% |
| Debt to Equity (Latest) ⓘ | -345.06% | 29.44% |
| Profit Margin (Latest) ⓘ | 0.67% | 3.52% |
| Free Cash Flow (Latest) ⓘ | $4.53B | |
Momentum (Price trend) | ||
| 3Y Return ⓘ | +174.92% | +34.80% |
| 12M Return (excl. last month) ⓘ | +61.69% | +19.33% |
| 6M Return ⓘ | +11.58% | +7.18% |
| Price vs. 200-Day MA ⓘ | +9.74% | +3.20% |
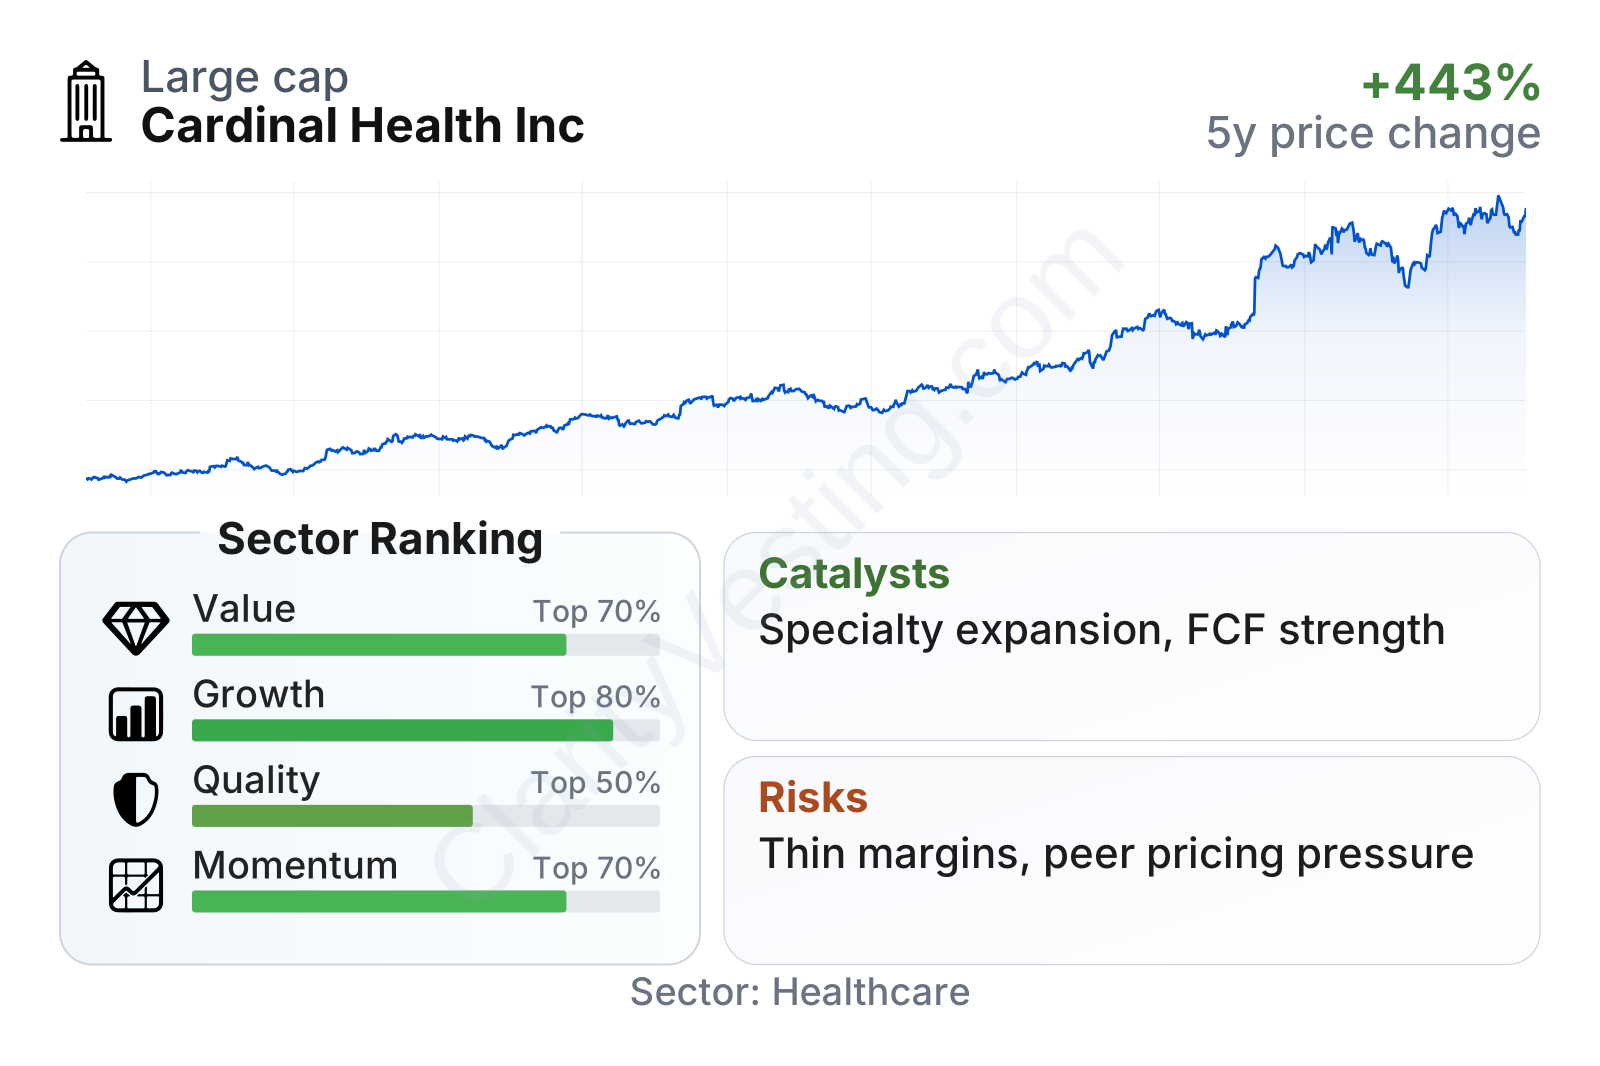
Cardinal Health is a very large healthcare company with a market value above $50 billion and a relatively low share-price volatility profile, reflected in a beta well below 1.0. In the factor summary, its profile is mixed but understandable: value and growth metrics look solid relative to much of the healthcare sector, quality is more middle-of-the-pack, and momentum remains favorable after a very strong multi-year share-price run. Free cash flow stands out in particular, with a yield far above the sector median, while return on invested capital is also notably strong. The weaker points are low accounting margins and leverage measures that look less comfortable than many healthcare peers.
Growth
Cardinal Health operates in a sector with durable long-term demand. Healthcare usage tends to rise over time because of aging populations, growing prescription drug consumption, complex specialty therapies, and the constant need for hospitals and clinics to replenish supplies. Distribution is not the fastest-growing corner of healthcare, but it benefits from volume growth and from the increasing complexity of getting products to the right place at the right time.
The company’s strategy broadly makes sense for that environment. Its core pharmaceutical distribution business benefits from scale, and management has also leaned into specialty pharmaceuticals, oncology, at-home solutions, and precision health, which are areas with better structural growth than traditional wholesale distribution alone. In medical products, Cardinal Health has been working to improve profitability after a period of operational pressure, which is important because even modest gains in efficiency can materially improve earnings.
Revenue growth has not been perfectly smooth, but the broader picture is still constructive. After a strong period in 2022 through 2024, growth softened and briefly turned negative in parts of 2025 before reaccelerating. The latest annual pace is back in the mid-single digits, which is not exceptional for healthcare overall but is respectable for a mature distributor of this size.
Cash generation is one of the more encouraging parts of the recent picture. Free cash flow has been volatile from year to year, which is common in distribution businesses because working capital can move around, but the overall level remains strong. The latest trailing figure is above $4 billion, and the five-year cash flow growth trend is meaningfully stronger than the sector median. That matters because cash gives the company room to support operations, invest in the business, reduce debt over time, and return capital to shareholders.
A notable catalyst in the current setup is Cardinal Health’s expanding role in specialty and higher-complexity healthcare services. These activities are harder to replicate than basic bulk distribution and can support better economics over time. Another favorable element is the company’s continued recovery in operating income, which indicates that earnings are growing faster than sales. In a low-margin industry, that kind of operational progress can be powerful.
Recent company updates in fiscal 2026 also point to continued focus on specialty platforms, pharmaceutical services, and productivity initiatives. None of these changes transform the business overnight, but together they support the idea that Cardinal Health is trying to move from being just a scale distributor to being a broader healthcare services and supply-chain partner.
Risks
This article is for informational purposes only and does not constitute financial advice. Some content is AI-generated. See Disclaimer