Stock Analysis · Credit Acceptance Corporation (CACC)
Overview
Credit Acceptance Corporation is a specialty auto finance company focused on consumers who often have limited access to traditional credit. Its core role is to help car dealers sell vehicles to buyers with weaker credit histories by financing those purchases. The company works mainly through independent and franchised dealerships across the United States, using a model that combines underwriting, loan servicing, and collections.
The business is centered on financing used vehicle purchases, but the way it earns money is more specific than a typical lender. Based on its public filings, revenue is primarily generated from finance charges and other income tied to its managed loan portfolio rather than from multiple unrelated business lines. In practical terms, the company’s revenue sources can be grouped as follows:
- Finance charges and fees on consumer loans and dealer advances: approximately 90%+ of total revenue in recent years. This includes interest income and the economic yield generated from loans originated through dealer partners.
- Change in expected cash flows and portfolio-related adjustments: a meaningful but variable portion of reported revenue and profitability, depending on collections expectations, credit performance, and accounting estimates.
- Other revenue: a small residual amount from ancillary items that are not central to the lending model.
What makes Credit Acceptance different is its long-established dealer-partner program. Dealers submit applications, the company advances part of the financed amount, and then shares in collections from the consumer contract over time. That structure helps dealers serve borrowers who may be declined elsewhere, while giving Credit Acceptance exposure to high-yield lending with elevated but managed credit risk.
Over the last several years, revenue has generally held up well, and operating profitability has remained unusually high for the sector, but earnings have been more volatile because results depend heavily on loan performance assumptions, funding costs, and collection outcomes. That combination makes the company relatively easy to understand at a business level, but more complex beneath the surface than a standard bank or consumer lender.
The long-term pattern shows a business that can generate strong gross profit and high operating margins, but with net income moving much more sharply from year to year. The gap between operating profit and net profit has been influenced by funding costs and portfolio-related swings, which is important when judging the durability of earnings.
Key Figures
| Metric | Value | Sector ⓘ |
|---|---|---|
| Date | Oct 03, 2026 | |
| Context | ||
| Sector | Financial Services | |
| Industry | Credit Services | |
| Market Cap ⓘ | $5.51B | |
| Beta ⓘ | 1.35 | |
Value (Cheapness) | ||
| P/E Ratio ⓘ | 11.85 | 12.60 |
| P/B Ratio ⓘ | 3.46 | 1.23 |
| FCF Yield ⓘ | 22.15% | 10.16% |
| Dividend Yield ⓘ | N/A | 2.96% |
| EBIT / EV ⓘ | 8.08% | 7.77% |
| PEG ⓘ | 1.15 | |
Growth (Business expansion) | ||
| Revenue Growth ⓘ | 9.50% | 9.50% |
| RPS Growth (5Y CAGR) ⓘ | 15.60% | 12.10% |
| EPS Growth (5Y CAGR) ⓘ | -20.04% | -9.45% |
| BVPS Growth (5Y CAGR) ⓘ | 4.47% | 5.01% |
| Margin Growth (5Y Trend) ⓘ | -23.47% | -4.07% |
| FCF Growth (5Y CAGR) ⓘ | -0.21% | 4.96% |
| DPS Growth (5Y CAGR) ⓘ | N/A | 8.79% |
Quality (Business durability) | ||
| ROIC (Latest) ⓘ | 9.57% | 9.60% |
| ROE (Latest) ⓘ | 31.69% | 13.84% |
| ROA (Latest) ⓘ | 5.81% | 1.53% |
| ROIC (5Y Median) ⓘ | 8.36% | 7.86% |
| ROE (5Y Median) ⓘ | 25.90% | 12.20% |
| ROA (5Y Median) ⓘ | 4.38% | 1.29% |
| Net Debt / EBIT (Latest) ⓘ | 6.46 | 0.91 |
| Net Debt / EBIT (5Y Median) ⓘ | 6.53 | 0.74 |
| Net Debt / EBITDA (Latest) ⓘ | 6.29 | 0.97 |
| Operating Margin (Latest) ⓘ | 41.88% | 22.12% |
| Operating Margin (5Y Median) ⓘ | 38.52% | 24.39% |
| Debt to Equity (Latest) ⓘ | 395.63% | 60.37% |
| Profit Margin (Latest) ⓘ | 38.51% | 26.62% |
| Free Cash Flow (Latest) ⓘ | $1.22B | |
Momentum (Price trend) | ||
| 3Y Return ⓘ | +12.08% | +89.23% |
| 12M Return (excl. last month) ⓘ | +15.44% | +17.35% |
| 6M Return ⓘ | +22.01% | +10.00% |
| Price vs. 200-Day MA ⓘ | -3.32% | +3.73% |
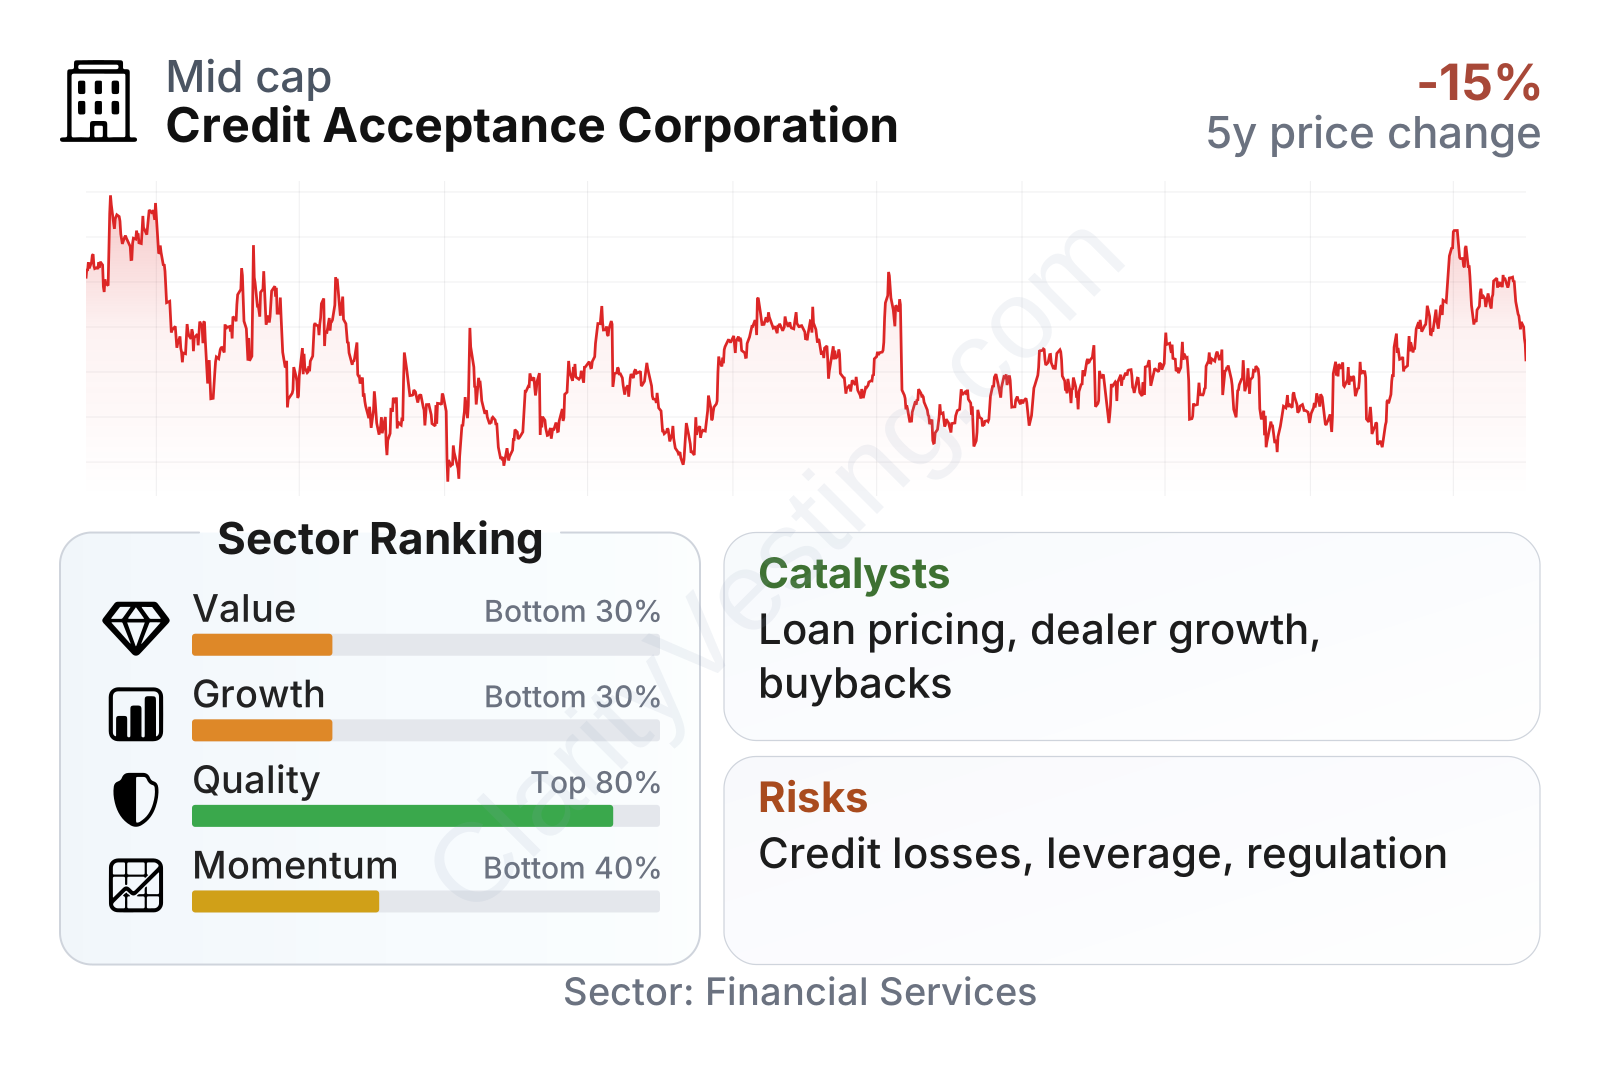
Credit Acceptance sits in the mid-cap range and its share price has been more volatile than the broader market, which fits the profile of a lender exposed to credit cycles. The overall picture is mixed: profitability and cash generation stand out, while growth and market momentum look weaker relative to much of the financial sector. Valuation is not stretched on earnings and cash flow measures, but the stock trades at a clear premium on book value, reflecting the market’s view that this business earns much higher returns than a typical finance company.
Growth
The company operates in a part of consumer finance that is likely to remain relevant: non-prime auto lending. Demand is supported by a large group of borrowers who still need transportation for work and daily life but may not qualify for conventional financing. That does not make the sector easy or consistently fast-growing, yet it does create a durable need that is less dependent on new technology trends than many other industries.
Credit Acceptance’s strategy is logical for this market. It has built a dealer network, underwriting infrastructure, and servicing operation designed specifically for higher-risk borrowers. Scale matters here because performance improves with data, pricing discipline, and collections experience. The company’s long operating history in this niche gives it a practical advantage in assessing credit risk and dealer behavior.
A notable growth lever is origination volume when dealer enrollment, used vehicle affordability, and approval economics improve at the same time. If funding conditions stabilize and the company can price loans to match risk, new loan production can expand without requiring a major change in the business model. The company has also used share repurchases over time, which can support per-share results when earnings normalize.
Earnings per share have not followed a straight line. They were exceptionally strong earlier in the cycle, then moved lower before showing signs of improvement. That suggests the core franchise remains profitable, but also shows how sensitive reported earnings are to credit assumptions and the cost of capital.
Book value per share has trended upward over the longer term, although not smoothly. That matters because it indicates the company has still compounded underlying equity despite a difficult operating period for many lenders. The pace of book value growth has been more modest than the company’s strongest historical periods, but the direction remains constructive over a multi-year view.
Recent company updates have continued to emphasize active loan pricing, disciplined originations, and capital management. The most meaningful opportunity is not a sudden new product launch; it is the possibility that a better credit environment and steadier funding markets allow the existing platform to produce stronger returns on a larger origination base.
Risks
This article is for informational purposes only and does not constitute financial advice. Some content is AI-generated. See Disclaimer