Stock Analysis · Citigroup Inc (C)
Overview
Citigroup is one of the largest global banks. It serves multinational corporations, financial institutions, governments, investors, and consumers. In simple terms, it helps move money across borders, lends money, advises on deals, trades in financial markets, provides credit cards and consumer banking services in selected countries, and manages large pools of deposits and liquidity for institutional clients.
Its business is organized around a few major activities. Based on the company’s recent reporting structure, the main revenue sources are approximately:
- Services: about 24% of total revenue. This includes treasury and trade solutions, payments, cash management, and securities services for large corporate and institutional clients.
- Markets: about 21%. This covers fixed income, currencies, commodities, equities, and related trading and financing services.
- U.S. Personal Banking: about 19%. This mainly includes branded cards, retail banking, and consumer lending in the United States.
- Banking: about 15%. This includes investment banking, corporate lending, and commercial banking services.
- Wealth: about 8%. This business serves affluent and high-net-worth clients with investment, banking, and advisory offerings.
- All Other / legacy and corporate items: roughly 13%, which can include discontinued or wind-down operations, treasury activity, and corporate-level items.
What stands out is the mix: Citigroup is less dependent on plain consumer lending than many traditional banks, and more exposed to global transaction services, institutional relationships, and capital markets activity. That gives it a broad revenue base, but it also makes results more sensitive to market conditions and global economic activity.
The long-term restructuring is also important. Citigroup has spent the last several years simplifying the company, exiting a number of overseas consumer businesses, and pushing more resources toward institutional services, wealth, and U.S. cards. That strategy aims to make the group easier to manage and improve returns over time.
The business has grown its top line strongly over the last few years, but profitability has not risen as smoothly. Revenue is materially above 2021 levels, while operating costs and interest expense also remain high. That combination explains why scale alone has not yet translated into best-in-class returns.
Key Figures
| Metric | Value | Sector ⓘ |
|---|---|---|
| Date | Oct 19, 2026 | |
| Context | ||
| Sector | Financial Services | |
| Industry | Banks - Diversified | |
| Market Cap ⓘ | $208.44B | |
| Beta ⓘ | 1.11 | |
Value (Cheapness) | ||
| P/E Ratio ⓘ | 12.11 | 12.26 |
| P/B Ratio ⓘ | 1.09 | 1.23 |
| FCF Yield ⓘ | -11.76% | 10.40% |
| Dividend Yield ⓘ | 2.00% | 3.02% |
| EBIT / EV ⓘ | 115.15% | 8.14% |
| PEG ⓘ | 0.60 | |
Growth (Business expansion) | ||
| Revenue Growth ⓘ | 8.00% | 9.25% |
| RPS Growth (5Y CAGR) ⓘ | 23.39% | 12.19% |
| EPS Growth (5Y CAGR) ⓘ | 6.68% | -9.36% |
| BVPS Growth (5Y CAGR) ⓘ | 6.20% | 4.99% |
| Margin Growth (5Y Trend) ⓘ | -22.61% | -3.86% |
| FCF Growth (5Y CAGR) ⓘ | N/A | 4.81% |
| DPS Growth (5Y CAGR) ⓘ | 3.26% | 8.79% |
Quality (Business durability) | ||
| ROIC (Latest) ⓘ | 3.19% | 9.49% |
| ROE (Latest) ⓘ | 8.88% | 13.87% |
| ROA (Latest) ⓘ | 0.69% | 1.54% |
| ROIC (5Y Median) ⓘ | 2.66% | 7.86% |
| ROE (5Y Median) ⓘ | 6.22% | 12.17% |
| ROA (5Y Median) ⓘ | 0.57% | 1.30% |
| Net Debt / EBIT (Latest) ⓘ | 18.11 | 0.99 |
| Net Debt / EBIT (5Y Median) ⓘ | 18.42 | 0.73 |
| Net Debt / EBITDA (Latest) ⓘ | 15.41 | 0.91 |
| Operating Margin (Latest) ⓘ | 14.18% | 22.30% |
| Operating Margin (5Y Median) ⓘ | 11.78% | 24.63% |
| Debt to Equity (Latest) ⓘ | 390.37% | 58.04% |
| Profit Margin (Latest) ⓘ | 23.21% | 26.57% |
| Free Cash Flow (Latest) ⓘ | -$24.51B | |
Momentum (Price trend) | ||
| 3Y Return ⓘ | +230.60% | +88.26% |
| 12M Return (excl. last month) ⓘ | +34.90% | +19.24% |
| 6M Return ⓘ | -2.98% | +4.70% |
| Price vs. 200-Day MA ⓘ | -1.09% | +3.66% |
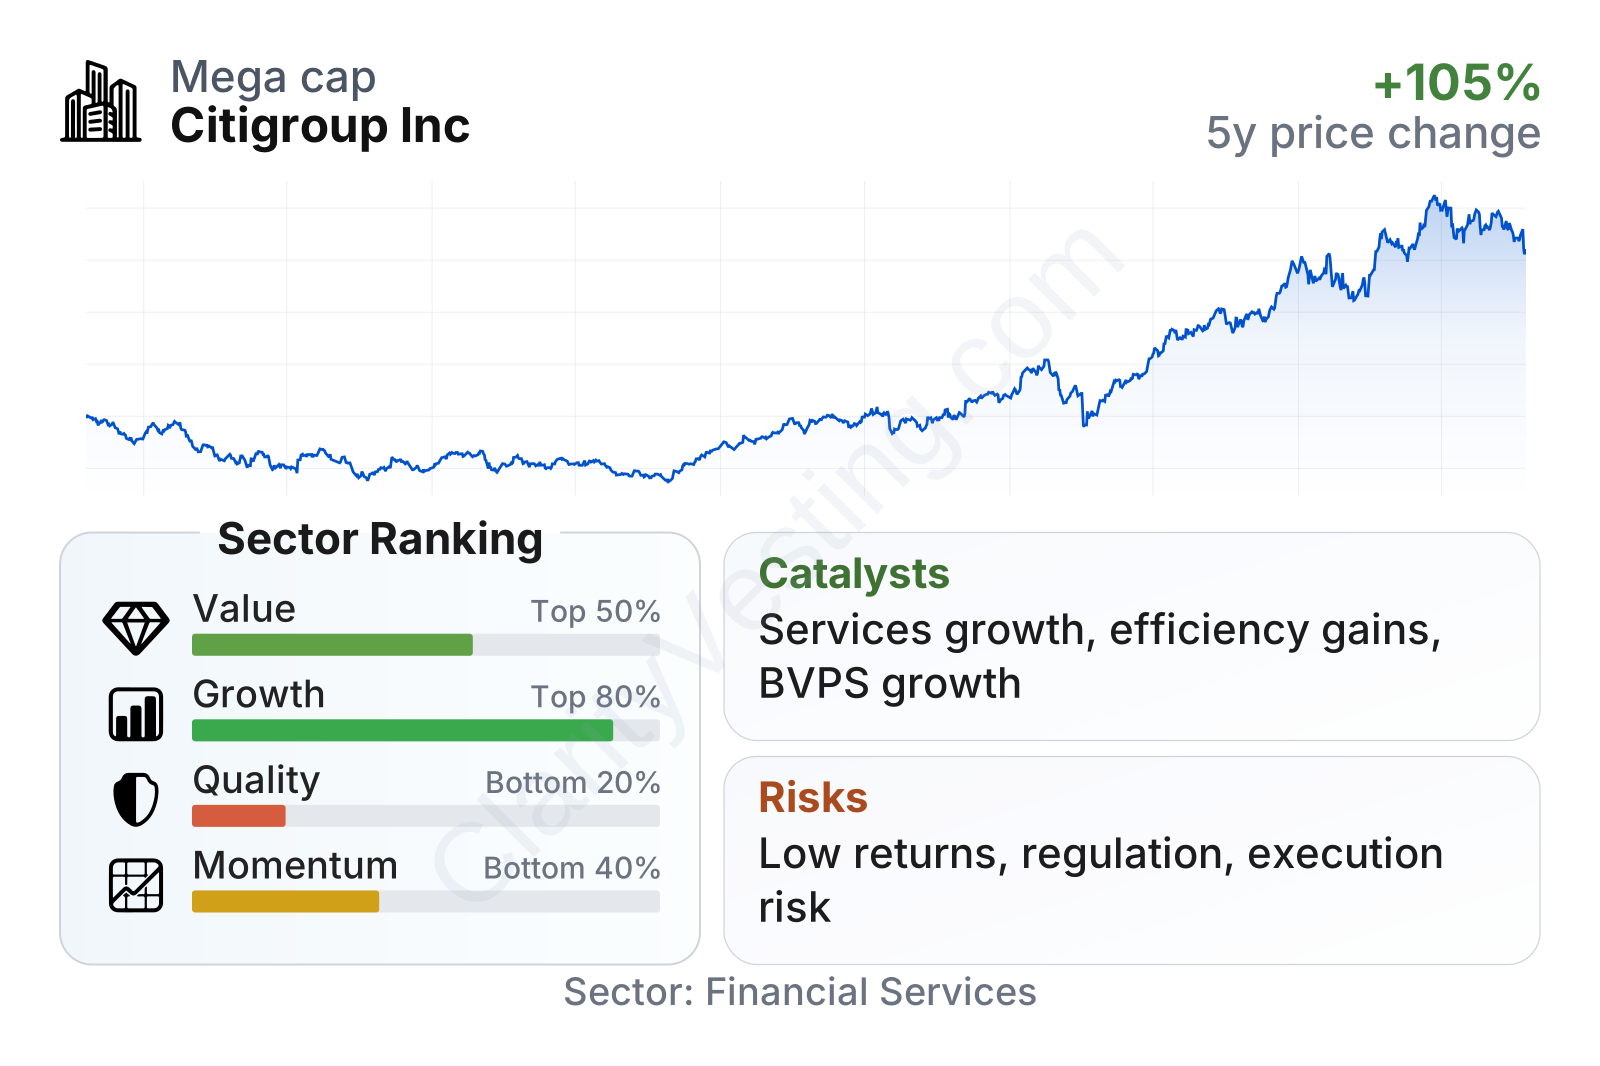
Citigroup is a very large bank with a stock that has been more volatile than the broad market, but not unusually so for a major global financial company. The share price trend has been strong over the last three years, even though the last several months have been more mixed.
The table suggests a familiar pattern for Citigroup: valuation looks moderate, growth metrics are relatively solid, but quality metrics remain weak versus the sector. Its price-to-earnings ratio is close to the sector median, while price-to-book remains below the industry median even after a strong rerating. Growth ranks in the upper part of the sector, helped by good multi-year revenue-per-share and earnings expansion, but returns on capital and profitability still trail many peers.
One point that needs context is free cash flow. For banks, free cash flow is often less informative than for industrial or software companies because balance sheet flows can heavily distort the number. For Citigroup, capital levels, tangible book value, credit quality, and return on equity usually matter more than free cash flow alone.
Growth
Citigroup operates in parts of banking that still have long-term relevance: cross-border payments, transaction banking, securities services, credit cards, wealth management, and institutional market activity. The sector is mature, so this is not a high-growth industry in the way software or semiconductors can be. However, some of Citi’s niches are supported by durable trends such as globalization of corporate treasury operations, higher demand for instant and cross-border payments, increasing capital markets activity over time, and rising wealth in international markets.
The company’s strategy broadly makes sense. Management has been reallocating capital away from lower-scale international consumer operations and toward businesses where Citi already has global reach. Services is especially important because it is one of the bank’s strongest franchises, supported by deep corporate relationships, large transaction volumes, and infrastructure that is difficult to replicate at global scale.
There is also a meaningful internal growth angle: Citigroup does not necessarily need rapid economic expansion to improve results. If it can simplify operations, reduce duplicated infrastructure, complete regulatory remediation work, and lift returns closer to peers, earnings can improve through efficiency and capital discipline as much as through revenue growth.
Earnings per share show that profits fell sharply from 2021 into 2023 and then began recovering through 2024, 2025, and into 2026. That matters because it shows the current phase is still partly a turnaround in profitability rather than a straight-line expansion. The positive side is that earnings momentum has improved after a weak period.
Book value per share has moved steadily higher over the last five years. For a bank, that is a useful signal because it shows net asset value has continued to build even through a difficult restructuring period. When a bank can grow book value while also cleaning up operations, it creates a stronger base for future returns if profitability improves.
Recent company updates have also pointed to continued investment in the core franchise, including payments, wealth, and digital capabilities. Another important catalyst is capital return capacity over time: once profitability improves and major remediation spending starts to normalize, the gap between earnings power and valuation could become more visible.
Risks
This article is for informational purposes only and does not constitute financial advice. Some content is AI-generated. See Disclaimer


