Stock Analysis · Buzzi Unicem SpA (BZZUY)
Overview
Buzzi Unicem is an Italy-based building materials company focused mainly on cement, ready-mix concrete, and aggregates. These are basic inputs used to build roads, bridges, factories, homes, warehouses, and other infrastructure. The company operates production plants and distribution networks across several countries, with a particularly important presence in the United States and Europe. Because cement is heavy and expensive to transport over long distances, this industry is usually local or regional in nature, which makes plant location and logistics a meaningful part of competition.
The business is relatively easy to understand: Buzzi extracts or buys raw materials, produces cement, and then sells cement directly or uses it in downstream concrete operations. Demand is tied to construction activity, infrastructure spending, industrial projects, and housing markets. Results are also heavily influenced by energy costs, transportation costs, and local pricing discipline.
Based on company reporting, revenue is mainly generated by the following activities, listed from largest to smallest:
- Cement: approximately 70% to 75% of revenue. This is the core product and includes various types of cement sold to construction companies, distributors, and concrete producers.
- Ready-mix concrete: approximately 20% to 25% of revenue. This includes concrete produced and delivered for construction sites, often giving the company a stronger position closer to end customers.
- Aggregates and other activities: approximately 5% to 10% of revenue. This typically includes sand, gravel, and related products or services that support construction projects.
Geographically, the United States is one of the most important profit contributors, while Italy, Germany, Luxembourg, the Netherlands, Eastern Europe, and Mexico also matter to the group. This geographic spread helps reduce dependence on a single construction market, although it also exposes the company to different economic cycles and currency movements.
The recent earnings flow also shows a business that has improved profitability faster than revenue. Sales have grown from roughly €3.4 billion in 2021 to above €4.5 billion in 2025, while operating income and net income increased more sharply over that period. That suggests pricing, cost control, and product mix have been at least as important as simple volume growth.
The multi-year picture points to stronger conversion of sales into operating profit than a few years ago. Revenue has moved up moderately, but operating earnings expanded much faster, showing that pricing and margin discipline have played a major role in recent performance.
Key Figures
| Metric | Value | Sector ⓘ |
|---|---|---|
| Date | Oct 31, 2026 | |
| Context | ||
| Sector | Basic Materials | |
| Industry | Building Materials | |
| Market Cap ⓘ | $7.73B | |
| Beta ⓘ | 1.02 | |
Value (Cheapness) | ||
| P/E Ratio ⓘ | 7.91 | 16.71 |
| P/B Ratio ⓘ | 1.09 | 1.72 |
| FCF Yield ⓘ | 9.75% | 5.78% |
| Dividend Yield ⓘ | 1.84% | 2.17% |
| EBIT / EV ⓘ | N/A | 7.05% |
| PEG ⓘ | N/A | |
Growth (Business expansion) | ||
| Revenue Growth ⓘ | 0.10% | 10.85% |
| RPS Growth (5Y CAGR) ⓘ | 8.62% | 4.49% |
| EPS Growth (5Y CAGR) ⓘ | 32.39% | -12.99% |
| BVPS Growth (5Y CAGR) ⓘ | 14.32% | 5.51% |
| Margin Growth (5Y Trend) ⓘ | 11.47% | -1.42% |
| FCF Growth (5Y CAGR) ⓘ | 13.22% | 0.52% |
| DPS Growth (5Y CAGR) ⓘ | -9.42% | 6.02% |
Quality (Business durability) | ||
| ROIC (Latest) ⓘ | N/A | 9.28% |
| ROA (Latest) ⓘ | 16.12% | 4.90% |
| ROIC (5Y Median) ⓘ | 11.50% | 7.76% |
| ROA (5Y Median) ⓘ | 10.05% | 3.88% |
| Net Debt / EBIT (Latest) ⓘ | -0.62 | 1.35 |
| Net Debt / EBIT (5Y Median) ⓘ | -0.38 | 1.70 |
| Net Debt / EBITDA (Latest) ⓘ | -0.41 | 0.93 |
| Net Debt / Assets ⓘ | -7.71% | 12.93% |
| EBITDA / Interest ⓘ | N/A | 12.36 |
| Operating Margin (Latest) ⓘ | 14.63% | 12.74% |
| Operating Margin (5Y Median) ⓘ | 22.67% | 11.87% |
| Debt to Equity (Latest) ⓘ | 6.83% | 40.30% |
| Profit Margin (Latest) ⓘ | 18.96% | 6.58% |
| Free Cash Flow (Latest) ⓘ | $753.84M | |
Momentum (Price trend) | ||
| 3Y Return ⓘ | +80.09% | +75.47% |
| 12M Return (excl. last month) ⓘ | -21.24% | +22.27% |
| 6M Return ⓘ | -17.92% | -3.22% |
| Price vs. 200-Day MA ⓘ | -14.11% | -2.47% |
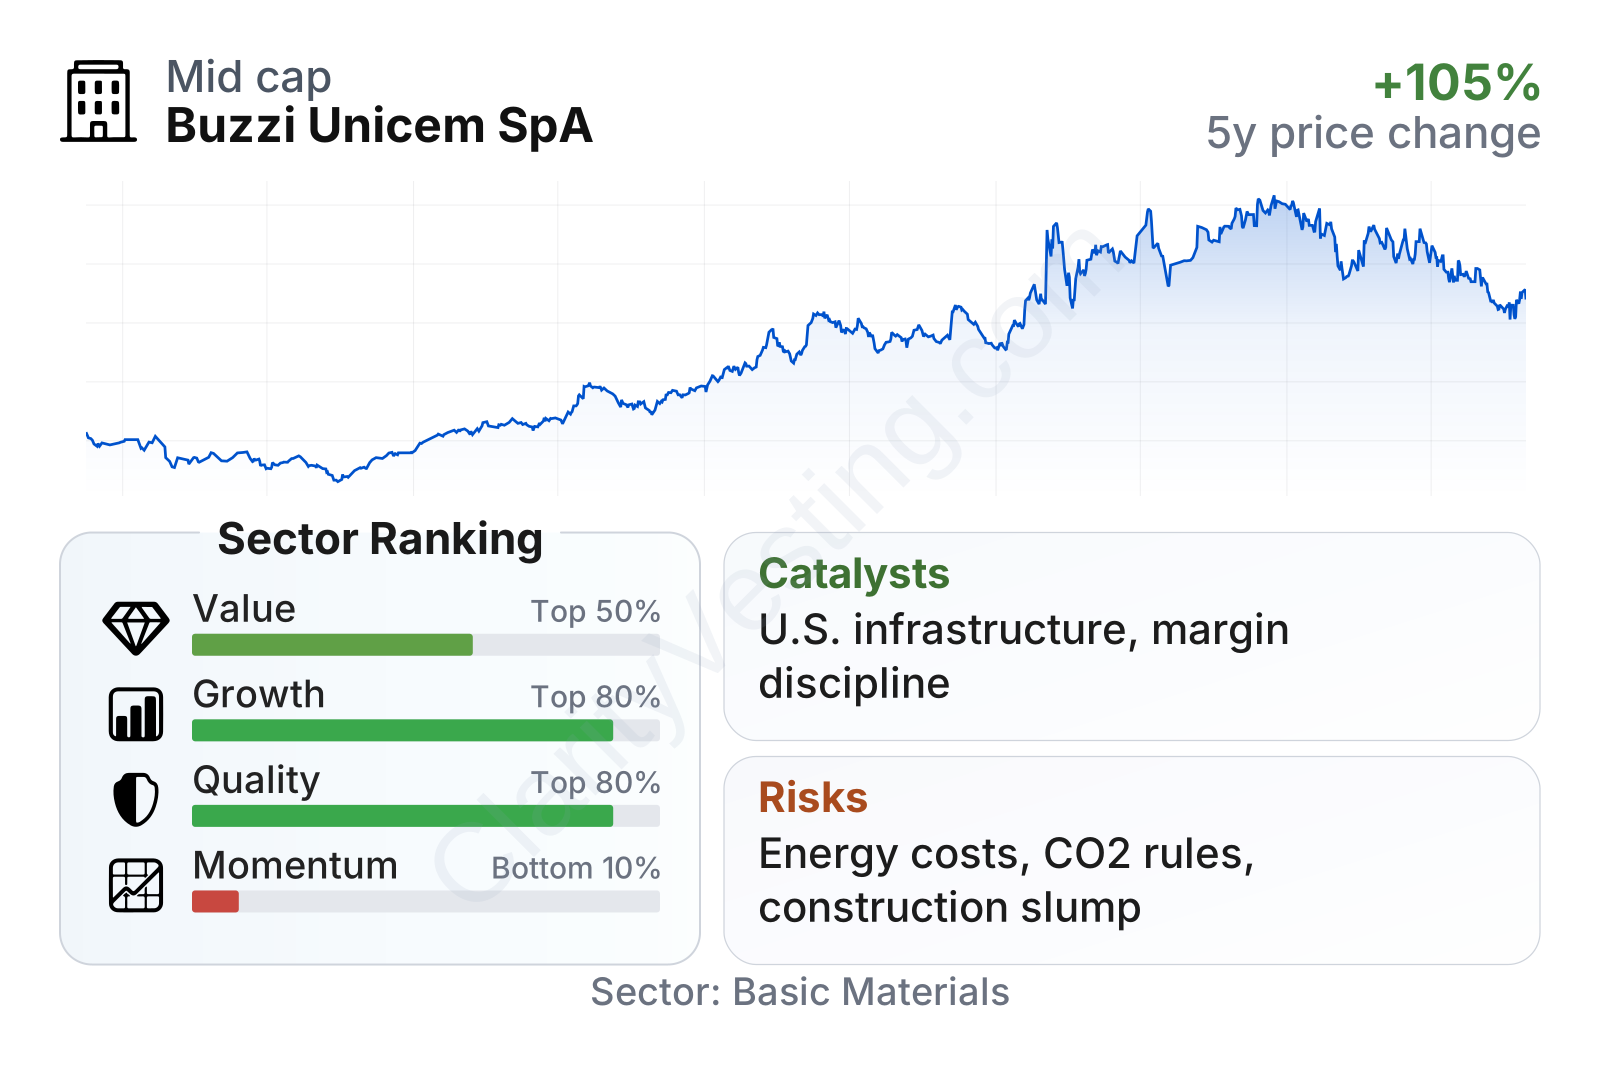
Buzzi Unicem stands out more on quality and long-term growth efficiency than on recent market momentum. The company’s valuation multiples sit below sector medians, while profitability, returns on assets, and cash generation look stronger than many peers. Balance sheet strength is especially notable, with very low leverage and even net cash characteristics on some debt measures. The weaker area is recent share-price momentum, which has softened despite a strong longer-term stock performance.
The stock has been volatile over the last several years, with a powerful rise from 2022 lows followed by a noticeable pullback in 2026. That pattern often appears in cyclical companies: business performance can remain solid even while the market reassesses construction demand, commodity costs, or macroeconomic conditions.
Growth
Buzzi operates in a sector that is mature, but not stagnant. Cement is not a high-tech growth industry, yet long-term demand can still expand through population growth, infrastructure renewal, industrial reshoring, logistics facilities, and public works. In developed markets, the strongest support usually comes less from new housing booms and more from infrastructure modernization and maintenance. In that context, Buzzi’s footprint in the United States is especially relevant because federal and state infrastructure programs can support volumes over multiple years.
The company’s strategy also makes practical sense for this kind of industry. Cement is a scale-and-location business where efficiency, plant utilization, logistics, and pricing matter more than rapid disruption. Buzzi has focused on maintaining an integrated network of cement plants, terminals, aggregates, and concrete operations in selected markets. That can help protect local market positions and improve margins over time.
Near-term revenue growth has cooled compared with the stronger expansion seen in 2022 and early 2023. More recently, annual sales growth has been low to mid-single digits, with some periods of temporary contraction. That slowdown does not automatically signal structural weakness, since cement producers often go through phases where volumes are soft but pricing remains supportive. Over a five-year view, revenue per share has still grown at a healthy pace, clearly above the sector median.
Cash generation is another important part of the growth profile. Free cash flow has remained strong overall, even with some year-to-year fluctuations. That matters because this is a capital-intensive business: plants require maintenance and periodic upgrades, so not every accounting profit turns into usable cash. Buzzi appears to be converting a meaningful share of earnings into cash while still preserving a conservative financial structure.
A further growth support is the company’s margin improvement over the last five years. Earnings per share, free cash flow, and book value per share have all advanced at rates that compare favorably with much of the building materials sector. That suggests the company’s progress has come not only from favorable markets but also from better business execution.
One significant catalyst is ongoing infrastructure and industrial investment in the United States, where cement demand can benefit from highways, manufacturing facilities, data centers, and energy-related construction. Another is the industry’s generally rational competitive structure in many local markets: when supply is disciplined, producers can offset inflation through pricing. In addition, lower leverage gives Buzzi flexibility for acquisitions, capacity investments, or shareholder distributions if opportunities emerge.
Risks
This article is for informational purposes only and does not constitute financial advice. Some content is AI-generated. See Disclaimer


