Stock Analysis · BXP Inc (BXP)
Overview
BXP Inc is a large U.S. office real estate investment trust, or REIT. It owns, develops, and manages primarily Class A workplace properties in major coastal markets, with a portfolio centered on Boston, New York, San Francisco, Seattle, Los Angeles, and Washington, D.C. In simple terms, BXP makes money by owning premium office buildings and related mixed-use assets, leasing space to tenants, and occasionally developing or selling properties.
Its business is still mainly a rent-collection model, but the portfolio is more specialized than that description suggests. BXP focuses on high-quality buildings in supply-constrained locations, often near major business districts and transit hubs. The company also has exposure to retail space within its properties, some residential and hotel interests through mixed-use projects, and development activity that can add new rentable space over time.
The main revenue sources are dominated by rental operations. Based on the company’s segment and property disclosures, the mix is best understood as follows:
- Office rental revenue: approximately 85% to 90% — base rent, escalations, and recoveries from tenants occupying office space in BXP’s core buildings.
- Tenant reimbursements and parking/other property income: approximately 8% to 12% — amounts tenants repay for operating costs, plus parking and other building-related income.
- Retail, residential, hotel, and other mixed-use income: low single-digit percentage of revenue — smaller contributions from non-office components embedded in certain developments.
- Development gains, property sales, and other non-recurring items: variable — these can materially affect profit in a given year, but they are not the core recurring revenue engine.
BXP’s recent financial pattern shows that revenue has continued to edge upward over the last several years, but profitability has been pressured by higher interest expense and weaker office market conditions. That distinction matters: the company is still generating substantial property income, yet the amount left over for shareholders has become more sensitive to financing costs and asset values.
The long-term picture from the income flow is relatively clear: top-line revenue has grown from roughly $2.9 billion in 2021 to about $3.5 billion in 2025, while operating income and net income have been far more volatile. The biggest drag has been rising interest expense, which has absorbed a larger share of property-level earnings as borrowing costs moved higher.
Key Figures
| Metric | Value | Sector ⓘ |
|---|---|---|
| Date | Oct 03, 2026 | |
| Context | ||
| Sector | Real Estate | |
| Industry | REIT - Office | |
| Market Cap ⓘ | $11.05B | |
| Beta ⓘ | 1.03 | |
Value (Cheapness) | ||
| P/E Ratio ⓘ | 33.21 | 17.35 |
| P/B Ratio ⓘ | 3.71 | 0.86 |
| FCF Yield ⓘ | 3.26% | 7.47% |
| Dividend Yield ⓘ | 4.59% | 4.75% |
| EBIT / EV ⓘ | 3.59% | 3.81% |
| PEG ⓘ | 2.32 | |
Growth (Business expansion) | ||
| Revenue Growth ⓘ | 3.70% | 5.30% |
| RPS Growth (5Y CAGR) ⓘ | 4.37% | 5.96% |
| EPS Growth (5Y CAGR) ⓘ | -2.88% | -11.41% |
| BVPS Growth (5Y CAGR) ⓘ | -8.37% | 0.41% |
| Margin Growth (5Y Trend) ⓘ | -6.91% | 0.53% |
| FCF Growth (5Y CAGR) ⓘ | -11.41% | 5.40% |
| DPS Growth (5Y CAGR) ⓘ | -1.91% | 5.02% |
Quality (Business durability) | ||
| ROIC (Latest) ⓘ | 3.41% | 5.77% |
| ROE (Latest) ⓘ | 11.67% | 7.64% |
| ROA (Latest) ⓘ | 1.16% | 2.85% |
| ROIC (5Y Median) ⓘ | 2.70% | 4.20% |
| ROE (5Y Median) ⓘ | 10.07% | 6.03% |
| ROA (5Y Median) ⓘ | 1.06% | 2.45% |
| Net Debt / EBIT (Latest) ⓘ | 17.04 | 7.57 |
| Net Debt / EBIT (5Y Median) ⓘ | 15.39 | 8.41 |
| Net Debt / EBITDA (Latest) ⓘ | 8.47 | 5.12 |
| Net Debt / Assets ⓘ | 62.78% | 37.84% |
| EBITDA / Interest ⓘ | 3.01 | 4.11 |
| Operating Margin (Latest) ⓘ | 26.38% | 35.40% |
| Operating Margin (5Y Median) ⓘ | 29.63% | 36.59% |
| Debt to Equity (Latest) ⓘ | 316.84% | 89.06% |
| Profit Margin (Latest) ⓘ | 9.30% | 19.99% |
| Free Cash Flow (Latest) ⓘ | $360.75M | |
Momentum (Price trend) | ||
| 3Y Return ⓘ | +22.48% | +30.60% |
| 12M Return (excl. last month) ⓘ | -3.40% | +7.55% |
| 6M Return ⓘ | +20.69% | +0.69% |
| Price vs. 200-Day MA ⓘ | -1.98% | -2.30% |
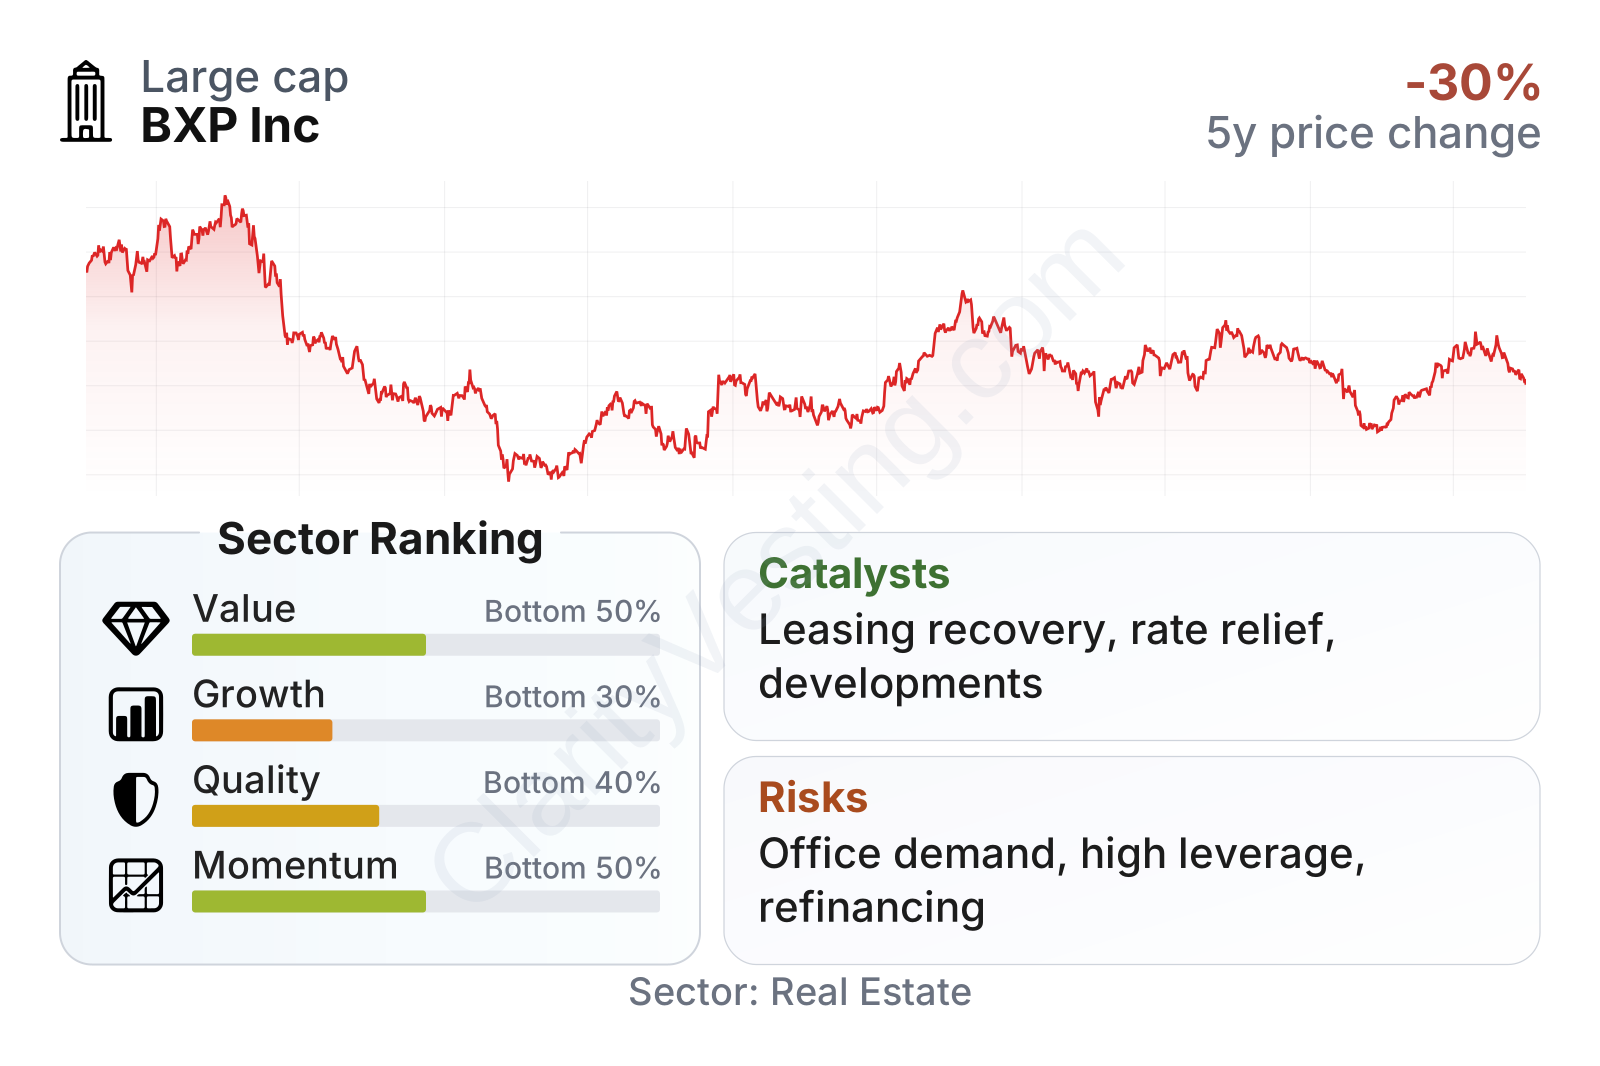
BXP is a large real estate company with a market value around $11 billion and a share price history that reflects the office sector’s turbulence. After a steep reset from 2022 into 2023, the stock has shown periods of recovery, but the path has remained uneven. The latest factor profile points to a business that ranks below much of the real estate sector on value, growth, and quality measures, largely because leverage is elevated, profitability has weakened, and valuation multiples remain above sector medians despite those pressures.
One nuance is that headline earnings ratios can be less informative for office REITs than cash-flow and balance-sheet measures. Even so, the broad message is consistent: BXP’s dividend yield is close to the sector range, but free cash flow yield is lower than the median and price-to-book sits well above most peers. That combination suggests the market is still assigning a premium to asset quality, even while operating metrics remain under pressure.
Growth
The office sector is not currently a strong growth area in the broad sense. Remote and hybrid work have changed demand patterns, and many cities still have elevated vacancy. However, the picture is more nuanced at the high end of the market. Premium buildings in top locations have generally held up better than older commodity office properties, especially when they offer modern design, amenities, sustainability features, and proximity to talent pools. BXP is positioned specifically in that upper tier, which gives it a more defensible growth angle than the office category as a whole.
BXP’s strategy for future growth is based on portfolio quality, selective development, redevelopment, and capital recycling. That approach makes strategic sense for a landlord operating in a challenged market: rather than trying to grow everywhere, the company is concentrating on buildings and locations where large corporate tenants are still willing to commit capital and sign long leases. This is particularly relevant in segments such as life sciences-adjacent space, trophy urban offices, and amenitized campuses where tenant standards are rising.
Revenue per share has moved steadily upward over the past five years, rising from the high teens to nearly $22. That is a useful sign because it shows the business has still been expanding its rent-generating base on a per-share basis, even in a difficult leasing environment. The problem is that this top-line progress has not translated cleanly into bottom-line improvement because financing costs and weaker margins have offset part of the benefit.
The dividend has been fairly stable for several years, with only a modest decline in the latest period. For a REIT, that stability matters because it signals that recurring cash generation has not collapsed. At the same time, the lack of dividend growth also says something important: management is operating in a period where balance-sheet flexibility is more valuable than aggressive payout expansion.
Potential catalysts are tied less to rapid industry expansion and more to normalization. If office leasing in gateway cities continues to stabilize, if return-to-office patterns improve, or if interest rates ease further, BXP could benefit through better occupancy, firmer rents on premium assets, and lower refinancing pressure. Another possible positive driver is the company’s development pipeline and redevelopment opportunities, which can create value if new projects are delivered into pockets of stronger demand. Recent company updates have also emphasized leasing activity, premier asset demand, and capital allocation discipline, all of which matter more than raw sector growth at this stage of the cycle.
Risks
This article is for informational purposes only and does not constitute financial advice. Some content is AI-generated. See Disclaimer


