Stock Analysis · The Baldwin Insurance Group Inc (BWIN)
Overview
The Baldwin Insurance Group is an insurance distribution and advisory company. In simple terms, it helps individuals, businesses, and organizations buy insurance coverage, manage benefits programs, and receive risk management advice. Rather than taking insurance risk on its own balance sheet like an insurance carrier, Baldwin mainly acts as an intermediary between customers and insurers and earns fees and commissions for that service.
The company operates in the insurance brokerage industry, a part of financial services that tends to benefit from recurring customer relationships, policy renewals, and a broad need for protection products across the economy. Baldwin has built its platform through a mix of organic expansion, producer recruiting, and acquisitions, aiming to create a scaled national broker with specialization in several attractive niches.
Based on the company’s recent filings, revenue is primarily generated from commissions and fees tied to insurance placement and related services. Public disclosures indicate a business mix centered on property & casualty insurance and employee benefits, with additional exposure to personal insurance and other specialty products. Exact percentages can vary by period and acquisition activity, but the business appears to be weighted toward commercial insurance distribution.
Main revenue sources can be summarized as follows:
- Property & Casualty insurance brokerage — the largest contributor, likely representing a majority of total revenue. This includes commercial lines for businesses and organizations, along with specialty placements and risk advisory services.
- Employee benefits brokerage — a meaningful secondary contributor. This generally includes health, welfare, and related benefits consulting for employers.
- Personal insurance — a smaller but still relevant stream, covering policies such as home, auto, and other personal lines for individuals and families.
- Other fees and advisory income — the smallest category, including service fees and certain consulting-related revenues.
Over the last several years, the business has expanded rapidly in size. Total revenue rose from roughly $560 million in 2021 to about $1.50 billion in 2025. Operating income also improved over that period, although net income remained negative because interest expense and other costs continued to weigh on results. That combination is important: the company has clearly been getting larger, but the final profitability picture is still not fully mature.
The revenue path has been strong, but the profit conversion has been uneven. Growth in operating income suggests the core platform is scaling, yet persistent net losses show that financing costs and balance sheet structure still matter a great deal for the long-term case.
Key Figures
| Metric | Value | Sector ⓘ |
|---|---|---|
| Date | Oct 24, 2026 | |
| Context | ||
| Sector | Financial Services | |
| Industry | Insurance Brokers | |
| Market Cap ⓘ | $4.49B | |
| Beta ⓘ | 1.00 | |
Value (Cheapness) | ||
| P/E Ratio ⓘ | N/A | 12.46 |
| P/B Ratio ⓘ | 6.34 | 1.25 |
| FCF Yield ⓘ | 0.97% | 9.82% |
| Dividend Yield ⓘ | N/A | 2.94% |
| EBIT / EV ⓘ | -1.82% | 8.11% |
| PEG ⓘ | N/A | |
Growth (Business expansion) | ||
| Revenue Growth ⓘ | 30.10% | 9.10% |
| RPS Growth (5Y CAGR) ⓘ | 17.13% | 12.31% |
| EPS Growth (5Y CAGR) ⓘ | -3.25% | -6.97% |
| BVPS Growth (5Y CAGR) ⓘ | -39.54% | 5.02% |
| Margin Growth (5Y Trend) ⓘ | 2.16% | -4.00% |
| FCF Growth (5Y CAGR) ⓘ | N/A | 4.71% |
| DPS Growth (5Y CAGR) ⓘ | N/A | 8.92% |
Quality (Business durability) | ||
| ROIC (Latest) ⓘ | -3.44% | 9.18% |
| ROE (Latest) ⓘ | -35.46% | 13.93% |
| ROA (Latest) ⓘ | -1.63% | 1.57% |
| ROIC (5Y Median) ⓘ | N/A | 7.80% |
| ROE (5Y Median) ⓘ | -18.89% | 12.15% |
| ROA (5Y Median) ⓘ | -1.32% | 1.28% |
| Net Debt / EBIT (Latest) ⓘ | N/A | 1.02 |
| Net Debt / EBIT (5Y Median) ⓘ | 66.35 | 0.72 |
| Net Debt / EBITDA (Latest) ⓘ | 40.53 | 0.88 |
| Operating Margin (Latest) ⓘ | -7.30% | 22.30% |
| Operating Margin (5Y Median) ⓘ | 2.42% | 24.50% |
| Debt to Equity (Latest) ⓘ | 303.79% | 59.34% |
| Profit Margin (Latest) ⓘ | -4.68% | 26.42% |
| Free Cash Flow (Latest) ⓘ | $43.71M | |
Momentum (Price trend) | ||
| 3Y Return ⓘ | +52.88% | +95.73% |
| 12M Return (excl. last month) ⓘ | +4.14% | +17.30% |
| 6M Return ⓘ | +24.57% | +6.07% |
| Price vs. 200-Day MA ⓘ | +28.03% | +5.36% |
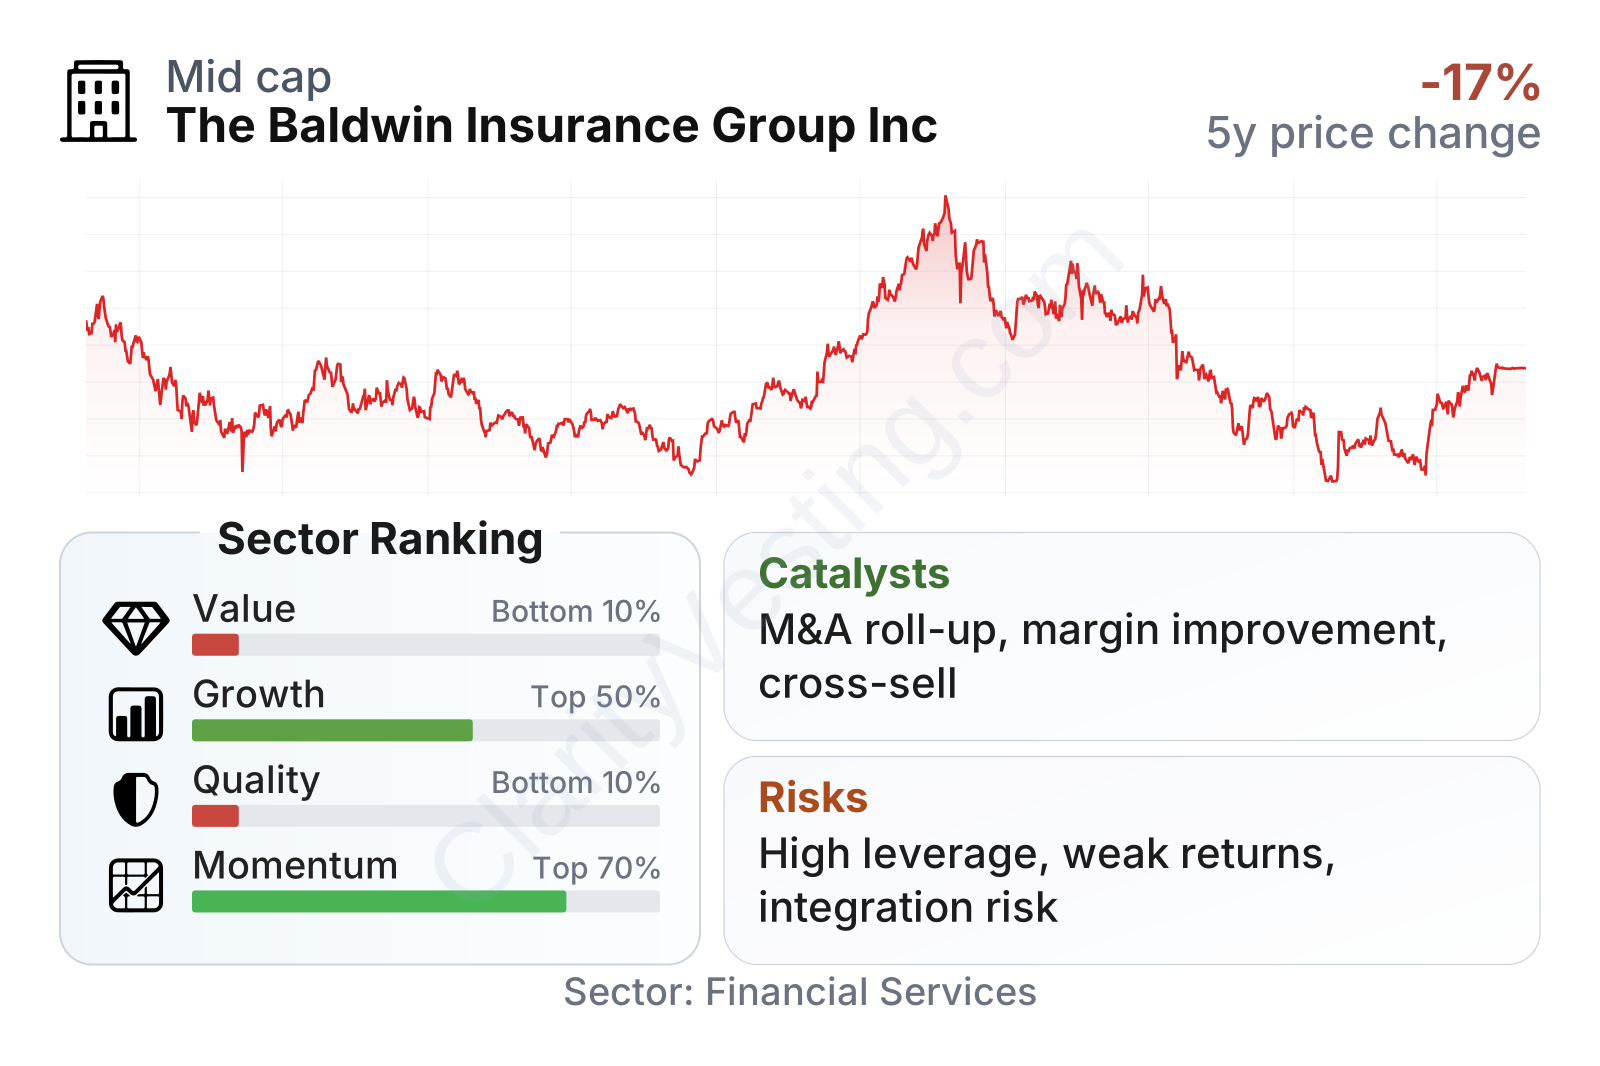
Baldwin is a mid-sized insurance broker with a market value a little above $3 billion and a stock volatility close to the broader market. The most notable contrast in the latest metrics is clear: growth looks relatively solid versus the sector, while value and quality measures rank weakly. Revenue growth is running well above the sector median, and the five-year revenue-per-share trend is also favorable. However, profitability, returns on capital, and leverage-related metrics remain much weaker than typical peers. The market has recently rewarded the shares with a better six-month trend, but the underlying fundamentals still show a company in transition rather than a fully polished compounder.
Growth
The company operates in a sector that has attractive long-term characteristics. Insurance brokerage tends to grow through a combination of premium inflation, exposure growth, cross-selling, and acquisitions. Unlike insurance carriers, brokers do not usually take underwriting risk directly, which can make their earnings profile more resilient when execution is sound. That gives well-run brokers a potentially durable expansion path, especially when they build specialized distribution networks and maintain strong renewal rates.
Baldwin’s strategy broadly fits that model. The company has been assembling a larger platform with multiple distribution channels and specialty capabilities. Recent years show a fast increase in revenue, including approximately 30% year-over-year growth in the latest metrics, which is far stronger than the sector median near 10%. Five-year revenue-per-share growth also sits above the sector median, suggesting expansion has not come only from issuing more shares.
Earnings per share have been uneven rather than consistently compounding. The general direction over the full period is better than the headline net-loss picture might suggest, with annual EPS moving higher from 2021 through 2023, dipping in 2024, then improving again in 2025. That pattern points to a business that is capable of scaling, but not yet one delivering a smooth year-after-year earnings progression.
Book value per share is a weaker part of the picture. It fell sharply from 2021 levels and has remained volatile since then. For an acquisitive broker, book value can be less informative than for a bank or insurer because intangible assets and deal accounting can heavily influence equity. Still, the decline helps explain why valuation based on book value now looks stretched.
A major catalyst for future growth is industry structure. Insurance brokerage remains fragmented, with many local and regional firms that can be acquired and integrated into larger networks. Scale matters because it can improve carrier access, data capabilities, recruiting, and cross-selling. Baldwin has also been positioning itself around middle-market and specialty clients, where expertise can support pricing power and retention. If the company can keep growing while gradually improving margins, the operating leverage could become much more visible.
Recent company communications have also highlighted continued platform development and a focus on integrating acquired operations more efficiently. That matters because the next phase for Baldwin is less about proving it can add revenue and more about proving it can translate size into stronger, steadier profitability.
Risks
This article is for informational purposes only and does not constitute financial advice. Some content is AI-generated. See Disclaimer


