Stock Analysis · BW Energy Limited (BWEFF)
Overview
BW Energy Limited is an independent oil and gas production company focused on offshore fields in West Africa and Brazil. Its business is relatively simple to understand: it develops oil fields, brings wells into production, sells crude oil cargoes, and uses the cash flow to fund additional drilling and new projects. The company’s producing base has been centered on the Dussafu license offshore Gabon, while its future growth pipeline includes the Maromba field in Brazil and the Kudu gas project in Namibia.
For a long-term reader, the key point is that BW Energy is not a diversified energy major. It is a smaller exploration and production company, so results are driven mainly by a limited number of assets, production uptime, and oil prices. That concentration can create stronger upside when projects work well, but it also makes the business more exposed to delays or field-specific issues than larger peers.
Revenue is overwhelmingly tied to crude oil sales. Based on company reporting and operating profile, the main sources of revenue can be summarized as follows:
- Crude oil sales from producing fields: approximately 95% to 100% of revenue. This mainly reflects oil lifted from offshore Gabon, where the company has been the most active producer.
- Other operating income and services: generally a small residual share when present. This can include non-core items, adjustments, or field-related reimbursements rather than a stable standalone business line.
- Future gas-related revenue: currently not a meaningful contributor, but the Kudu project could eventually add a second energy stream if development moves ahead.
Over the past few years, the business has shown a major increase in revenue and operating income as production expanded and oil prices remained supportive. At the same time, the mix is still narrow: one main commodity, a small number of core fields, and a project pipeline that matters a great deal for what the company may look like several years from now.
The financial flow over recent years shows a company that scaled up quickly, with revenue and operating profit improving sharply through 2024 before becoming less smooth afterward. That pattern fits an upstream producer: earnings can expand rapidly when production rises, but cash generation can swing as development spending and field performance change.
Key Figures
| Metric | Value | Sector ⓘ |
|---|---|---|
| Date | Oct 17, 2026 | |
| Context | ||
| Sector | Energy | |
| Industry | Oil & Gas E&P | |
| Market Cap ⓘ | $1.63B | |
| Beta ⓘ | 0.36 | |
Value (Cheapness) | ||
| P/E Ratio ⓘ | 17.03 | 15.44 |
| P/B Ratio ⓘ | 1.42 | 1.73 |
| FCF Yield ⓘ | -1.70% | 8.20% |
| Dividend Yield ⓘ | N/A | 3.59% |
| EBIT / EV ⓘ | 12.46% | 7.46% |
| PEG ⓘ | N/A | |
Growth (Business expansion) | ||
| Revenue Growth ⓘ | 80.00% | 26.90% |
| RPS Growth (5Y CAGR) ⓘ | 30.02% | 6.90% |
| EPS Growth (5Y CAGR) ⓘ | N/A | -15.73% |
| BVPS Growth (5Y CAGR) ⓘ | 15.07% | 6.07% |
| Margin Growth (5Y Trend) ⓘ | 8.14% | 0.58% |
| FCF Growth (5Y CAGR) ⓘ | N/A | 1.86% |
| DPS Growth (5Y CAGR) ⓘ | N/A | 16.79% |
Quality (Business durability) | ||
| ROIC (Latest) ⓘ | N/A | 11.40% |
| ROA (Latest) ⓘ | N/A | 6.06% |
| ROIC (5Y Median) ⓘ | 10.47% | 10.30% |
| ROA (5Y Median) ⓘ | 5.98% | 5.42% |
| Net Debt / EBIT (Latest) ⓘ | 1.59 | 1.64 |
| Net Debt / EBIT (5Y Median) ⓘ | 2.11 | 1.83 |
| Net Debt / EBITDA (Latest) ⓘ | 0.97 | 1.08 |
| Net Debt / Assets ⓘ | 17.39% | 17.29% |
| EBITDA / Interest ⓘ | 13.43 | 9.64 |
| Operating Margin (Latest) ⓘ | 32.32% | 16.27% |
| Operating Margin (5Y Median) ⓘ | 25.78% | 20.39% |
| Debt to Equity (Latest) ⓘ | N/A | 54.76% |
| Profit Margin (Latest) ⓘ | 12.21% | 8.82% |
| Free Cash Flow (Latest) ⓘ | -$27.70M | |
Momentum (Price trend) | ||
| 3Y Return ⓘ | +193.02% | +67.38% |
| 12M Return (excl. last month) ⓘ | +73.53% | +49.19% |
| 6M Return ⓘ | -0.79% | +7.07% |
| Price vs. 200-Day MA ⓘ | +14.54% | +9.56% |
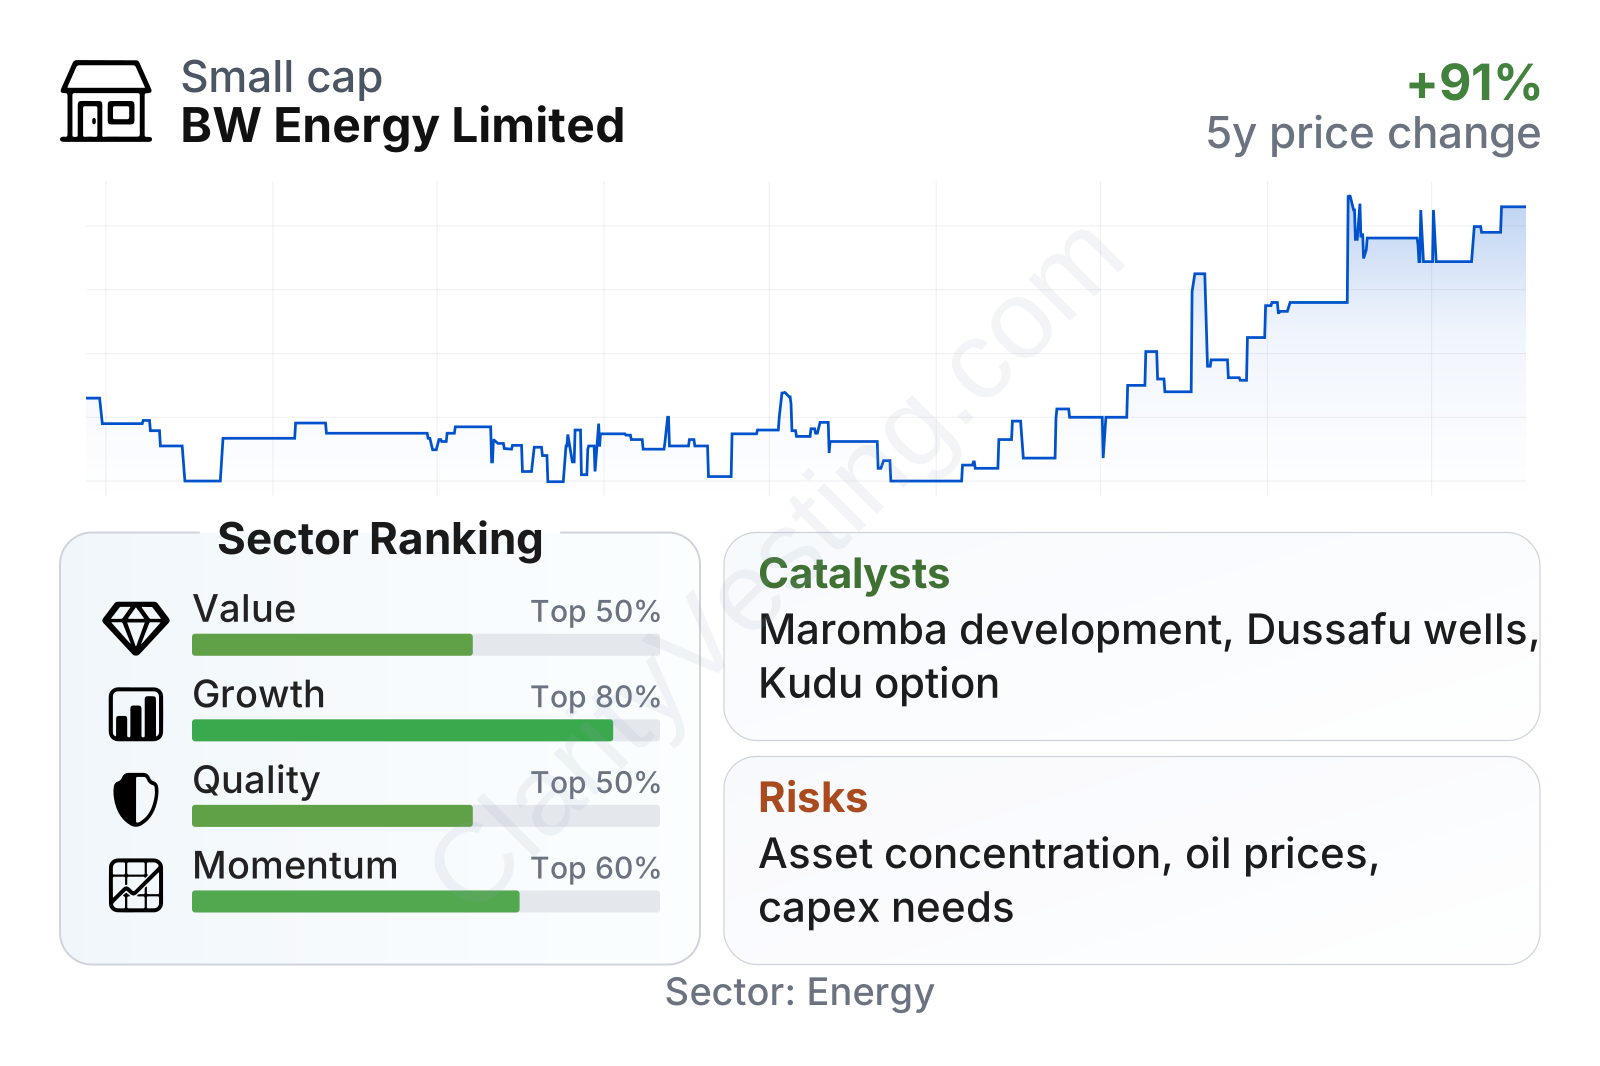
BW Energy sits in the smaller publicly traded range within the energy sector, with a market value around the low single-digit billions of dollars and a beta that has been relatively low for an oil producer. On valuation, the picture is mixed rather than uniformly cheap or expensive: earnings and book value multiples are close to sector norms, while free cash flow is currently weaker. On operating performance, margins stand out as stronger than many peers, and balance-sheet leverage looks manageable on an earnings basis. Growth indicators are notably strong, especially revenue expansion over one year and over five years per share, although those figures come from a low base and from a business that can be very volatile quarter to quarter.
Growth
BW Energy operates in a sector that still has long-term demand, but it is not a straightforward structural growth industry in the same way as software or digital services. Oil demand remains large globally, and offshore projects can stay economically relevant for many years, especially when they have attractive development costs. What matters here is less broad industry growth and more whether the company can add barrels efficiently from existing discoveries and convert undeveloped resources into cash-producing assets.
The company’s strategy is coherent for that objective. It has focused on assets where it believes redevelopment, infill drilling, and phased development can unlock more production without the scale of spending required by giant frontier megaprojects. That approach can be sensible for a smaller producer because it limits execution complexity compared with trying to build an entirely new basin position from scratch.
The recent revenue pattern has been highly uneven, which is normal for a company with cargo-based oil sales and a concentrated asset base. Even so, the broader direction over the last several years has been clearly upward, with growth rates well ahead of the sector median. The more important question for the next phase is whether project additions can make that growth less dependent on individual lifting schedules and short-term price effects.
Several visible catalysts could shape the next few years. One is continued development at Dussafu, where additional wells and infrastructure can support production volumes and reserve recovery. Another is the Maromba project in Brazil, which is one of the company’s most important medium-term growth assets. If execution stays on track, Maromba could materially change the company’s production base and reduce reliance on a single core area. The Kudu gas project also offers strategic optionality because it could add exposure to gas and power markets rather than oil alone.
Recent company updates have also pointed to ongoing field development activity, reserve maturation, and project preparation across these assets. For a smaller exploration and production company, those milestones matter because valuation often moves less on distant narratives and more on whether each development step de-risks future output and funding.
Risks
This article is for informational purposes only and does not constitute financial advice. Some content is AI-generated. See Disclaimer


