Stock Analysis · BUUU Group Limited (BUUU)
Overview
BUUU Group Limited is a small industrials company in the specialty business services area. Based on its public filings, the business has been built around service and product activities tied to commercial operations, with revenue generated from delivering those offerings rather than from a diversified set of unrelated business lines. The company is still relatively small in absolute size, which matters because a modest change in revenue, costs, or market attention can have a large effect on reported growth rates and on the stock price.
The latest public financial information available here points to a business that has been expanding revenue quickly over the last three fiscal years. Total revenue increased from about $3.5 million in fiscal 2023 to about $5.8 million in fiscal 2024 and then to about $6.3 million in fiscal 2025. At the same time, gross profit rose much faster than revenue, which suggests the company has recently been improving its pricing, mix, or operating efficiency.
Publicly available materials reviewed for this article do not provide a reliable segment breakdown detailed enough to assign precise percentages by revenue source. That means the business should currently be viewed as having a concentrated revenue base rather than a clearly diversified portfolio disclosed in detail.
What stands out most is the operating structure. Cost of revenue still absorbs the majority of sales, but that share has been falling over time, while gross profit has become a much larger part of the business. In fiscal 2023, gross profit was about 20% of revenue; in fiscal 2024 it rose to about 26%; and in fiscal 2025 it reached about 31%. That is a meaningful improvement for a service business at this scale.
The flow of revenue to profit shows a favorable trend: sales have grown steadily, gross margin has expanded, and operating income has remained solid even as overhead increased. The main caveat is that net income did not keep rising in fiscal 2025 despite higher revenue, which suggests the next phase depends on controlling expenses as the company scales.
Key Figures
| Metric | Value | Sector ⓘ |
|---|---|---|
| Date | Oct 31, 2026 | |
| Context | ||
| Sector | Industrials | |
| Industry | Specialty Business Services | |
| Market Cap ⓘ | $1.11B | |
| Beta ⓘ | N/A | |
Value (Cheapness) | ||
| P/E Ratio ⓘ | N/A | 21.91 |
| P/B Ratio ⓘ | 157.44 | 1.97 |
| FCF Yield ⓘ | N/A | 6.34% |
| Dividend Yield ⓘ | N/A | 1.88% |
| EBIT / EV ⓘ | N/A | 4.83% |
| PEG ⓘ | N/A | |
Growth (Business expansion) | ||
| Revenue Growth ⓘ | 12.30% | 9.50% |
| RPS Growth (5Y CAGR) ⓘ | 40.22% | 7.67% |
| EPS Growth (5Y CAGR) ⓘ | N/A | -11.63% |
| BVPS Growth (5Y CAGR) ⓘ | 71.32% | 6.14% |
| Margin Growth (5Y Trend) ⓘ | 5.31% | 0.71% |
| FCF Growth (5Y CAGR) ⓘ | 56.58% | 11.01% |
| DPS Growth (5Y CAGR) ⓘ | N/A | 9.31% |
Quality (Business durability) | ||
| ROIC (Latest) ⓘ | N/A | 10.70% |
| ROA (Latest) ⓘ | N/A | 5.45% |
| ROIC (5Y Median) ⓘ | N/A | 9.33% |
| ROA (5Y Median) ⓘ | N/A | 4.94% |
| Net Debt / EBIT (Latest) ⓘ | N/A | 2.03 |
| Net Debt / EBIT (5Y Median) ⓘ | 0.58 | 2.28 |
| Net Debt / EBITDA (Latest) ⓘ | N/A | 1.37 |
| Net Debt / Assets ⓘ | -64.57% | 19.16% |
| EBITDA / Interest ⓘ | N/A | 9.73 |
| Operating Margin (Latest) ⓘ | N/A | 10.49% |
| Operating Margin (5Y Median) ⓘ | 16.25% | 10.30% |
| Debt to Equity (Latest) ⓘ | 10.44% | 65.91% |
| Profit Margin (Latest) ⓘ | -3.96% | 6.61% |
| Free Cash Flow (Latest) ⓘ | N/A | |
Momentum (Price trend) | ||
| 3Y Return ⓘ | N/A | +69.18% |
| 12M Return (excl. last month) ⓘ | +414.56% | +12.04% |
| 6M Return ⓘ | +284.11% | +0.22% |
| Price vs. 200-Day MA ⓘ | +159.04% | +0.19% |
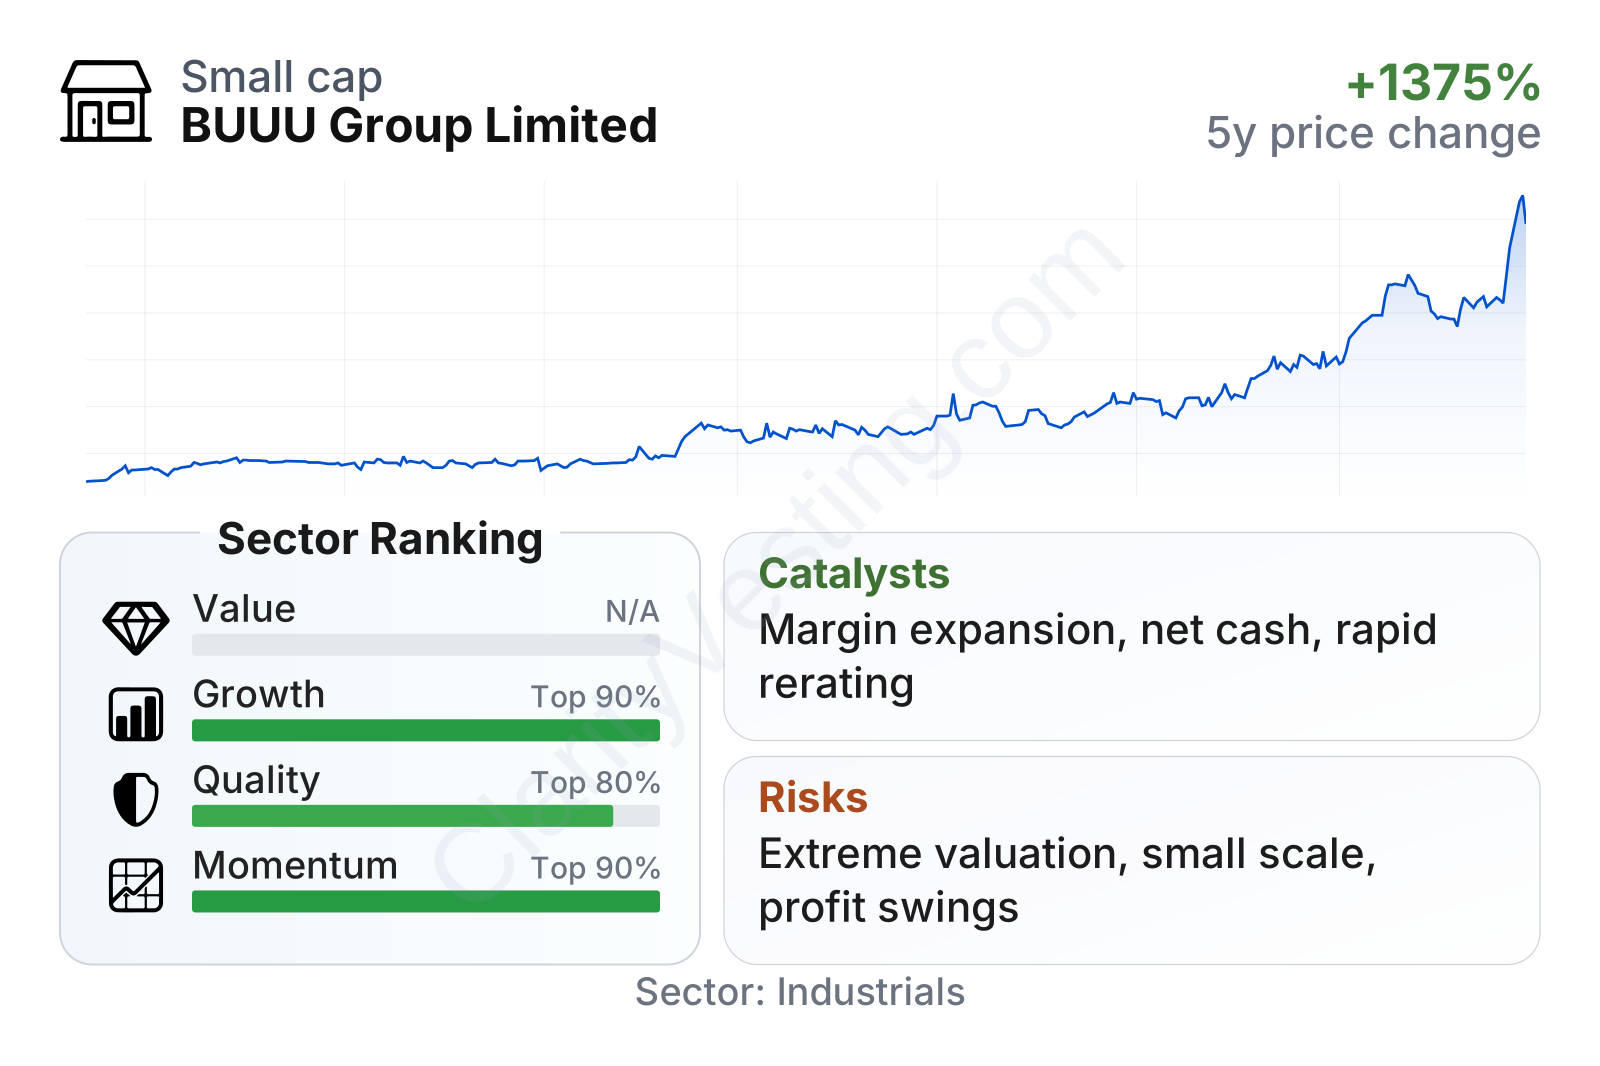
BUUU Group’s market value has moved into small-cap territory after a very sharp share-price run. Momentum has been exceptionally strong over the past 6 to 12 months, far ahead of the typical company in its sector. Growth metrics also rank very well versus peers, supported by double-digit recent revenue growth and much stronger multi-year expansion in revenue per share, book value per share, and free cash flow than the sector median.
On balance-sheet strength, the company appears conservative. Debt to equity is close to 10%, well below the sector median, and net cash appears to exceed debt, which gives BUUU more flexibility than many small industrial firms. However, profitability is less straightforward than the growth profile suggests. The latest net margin is negative, while the price-to-book multiple is extremely elevated versus the sector. That combination means the stock is being valued on expectations of future performance rather than on current accounting value or stable earnings power.
Growth
BUUU operates in a broad business services market, which can offer room for expansion because customers often outsource specialized functions to smaller providers that can respond quickly. The company’s recent numbers show that it has been capturing growth faster than the average industrial peer. A revenue growth rate of roughly 12% year over year is healthy on its own, but the more notable point is the five-year compounding pace in revenue per share and free cash flow, both of which have significantly outpaced the sector median.
The company’s strategy appears sensible if management can keep scaling without letting costs rise too quickly. Revenue has been growing, and gross margin has improved materially over the last three reported fiscal years. That often signals a business moving toward a better mix of work, stronger pricing, or improved execution. Long-term, that is one of the most important early indicators for a small services company because margin gains can have an outsized effect on earnings once the fixed-cost base is covered.
A clear catalyst has been the market’s re-rating of the shares. The stock rose from below $0.50 in mid-2025 to nearly $3.00 by late August 2026. That kind of move usually reflects a combination of stronger operating results, greater visibility, and rising investor awareness. While price gains alone do not create business value, they can help a company attract attention, improve access to capital, and support strategic flexibility if management wants to fund expansion.
Another positive point is the company’s financial position. With low leverage and signs of net cash, BUUU has more room than many small peers to invest in growth initiatives, absorb temporary pressure, or pursue acquisitions if suitable opportunities appear. In a fragmented services market, balance-sheet flexibility can become a practical advantage.
Risks
This article is for informational purposes only and does not constitute financial advice. Some content is AI-generated. See Disclaimer


