Stock Analysis · Webull Corp (BULL)
Overview
Webull Corp operates a digital investment platform centered on self-directed trading and wealth tools. Through its mobile app and desktop platform, users can trade stocks, exchange-traded funds, options, and in some markets futures, while also accessing market data, charting, watchlists, educational content, and community features. The company positions itself as a technology-led brokerage focused on active retail users who want a low-friction, app-based experience.
Its business model is mainly transaction- and platform-driven rather than subscription-led. Based on public filings, revenue is generated from a mix of trading-related income, interest-related income, and service fees tied to brokerage activity. The exact mix can shift meaningfully with trading volumes, interest rates, and customer cash balances, but the main sources can be summarized as follows:
- Trading-related revenue: this is typically the largest contributor and includes payment for order flow, execution-related arrangements, and other income linked to customer trading activity.
- Interest-related income: earned from margin lending, customer cash balances, securities lending, and treasury or cash-management activities.
- Service and other fees: includes platform-related fees, subscriptions for premium features where offered, transfer and withdrawal fees, and other brokerage service charges.
Recent financial progression shows a company that was roughly flat in revenue from 2022 to 2024, then moved into a much stronger growth phase in 2025. Revenue increased from about $388 million in 2022 to about $390 million in 2024, before rising to about $571 million in 2025. Profitability has also been uneven: the business was profitable in 2022, nearly break-even in 2023, slipped to a loss in 2024, and returned to positive net income in 2025. That pattern suggests a platform still scaling, with earnings influenced by customer activity and spending intensity.
The flow of revenue and costs highlights two important points. First, gross profit remains high, which is common for digital platforms with relatively light direct servicing costs. Second, operating expenses—especially sales, administration, and product development—have risen quickly, so the key question is whether revenue can continue growing fast enough to absorb that expense base.
Key Figures
| Metric | Value | Sector ⓘ |
|---|---|---|
| Date | Oct 24, 2026 | |
| Context | ||
| Sector | Technology | |
| Industry | Software - Application | |
| Market Cap ⓘ | $3.18B | |
| Beta ⓘ | 0.65 | |
Value (Cheapness) | ||
| P/E Ratio ⓘ | 73.75 | 29.68 |
| FCF Yield ⓘ | 7.19% | 4.28% |
| Dividend Yield ⓘ | N/A | 1.30% |
| EBIT / EV ⓘ | 2.34% | 2.70% |
| PEG ⓘ | N/A | |
Growth (Business expansion) | ||
| Revenue Growth ⓘ | 51.90% | 15.80% |
| RPS Growth (5Y CAGR) ⓘ | 19.38% | 8.56% |
| EPS Growth (5Y CAGR) ⓘ | -18.64% | -11.54% |
| Margin Growth (5Y Trend) ⓘ | -8.04% | 0.46% |
| FCF Growth (5Y CAGR) ⓘ | N/A | 9.76% |
| DPS Growth (5Y CAGR) ⓘ | N/A | 7.79% |
Quality (Business durability) | ||
| ROIC (Latest) ⓘ | 5.17% | 9.38% |
| ROIC (5Y Median) ⓘ | N/A | 8.32% |
| Net Debt / EBIT (Latest) ⓘ | -8.10 | 0.52 |
| Net Debt / EBIT (5Y Median) ⓘ | -11.36 | 0.46 |
| Net Debt / EBITDA (Latest) ⓘ | -9.03 | 0.28 |
| Net Debt / Assets ⓘ | -15.15% | 3.44% |
| EBITDA / Interest ⓘ | N/A | 13.20 |
| Operating Margin (Latest) ⓘ | 11.29% | 9.70% |
| Operating Margin (5Y Median) ⓘ | 7.03% | 8.51% |
| Debt to Equity (Latest) ⓘ | 7.54% | 33.40% |
| Profit Margin (Latest) ⓘ | 6.34% | 7.14% |
| Free Cash Flow (Latest) ⓘ | $228.95M | |
Momentum (Price trend) | ||
| 3Y Return ⓘ | -43.91% | +55.43% |
| 12M Return (excl. last month) ⓘ | -37.92% | +10.33% |
| 6M Return ⓘ | -13.98% | +7.97% |
| Price vs. 200-Day MA ⓘ | -13.26% | +5.41% |
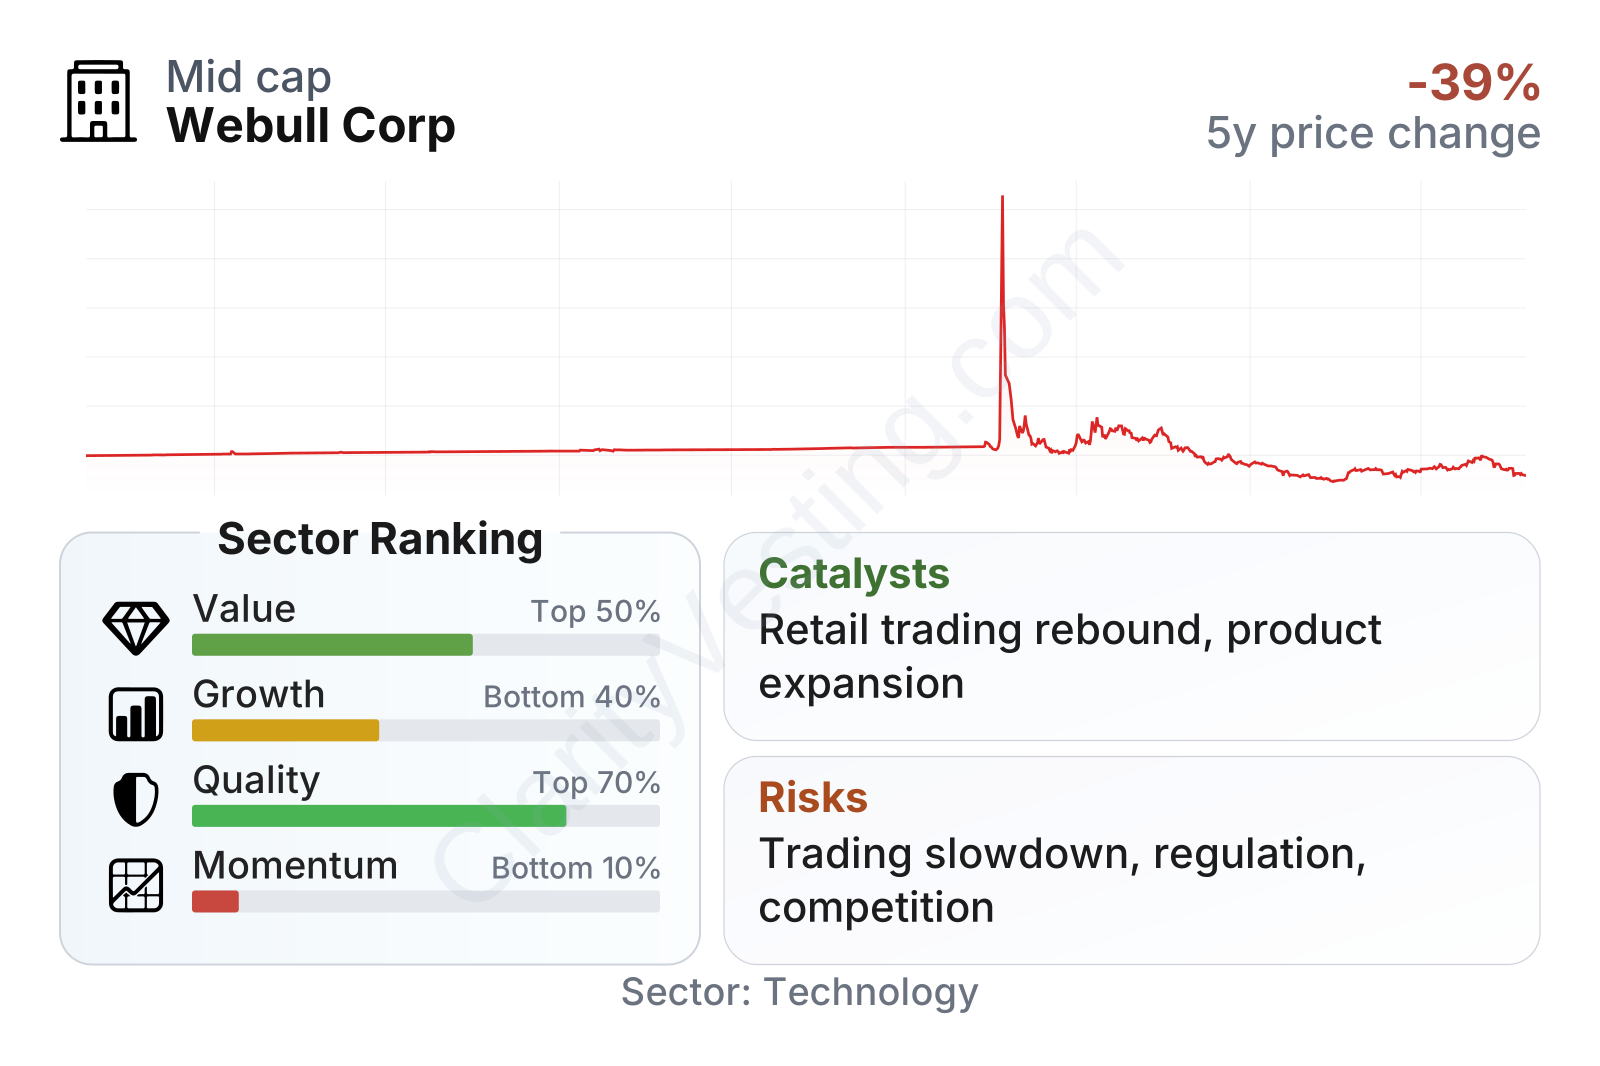
Webull is a mid-sized company by market value and its recent profile is unusual: valuation metrics look inexpensive versus much of the software sector, balance-sheet quality appears strong, but growth and market performance signals are mixed. The business generates positive free cash flow and uses relatively little debt, which provides flexibility. At the same time, earnings consistency remains limited, which helps explain why the shares have traded with sharp swings rather than a steady long-term uptrend.
Growth
Webull operates in a favorable long-term area: digital investing. Over time, retail brokerage continues to shift toward mobile-first platforms, lower fees, easier onboarding, and broader access to financial products. Younger users in particular tend to prefer app-based investing, which supports the broader sector outlook. This does not mean growth will be smooth every year, because activity often rises and falls with market sentiment, but the structural direction of the industry remains supportive.
Webull’s strategy also makes sense for expansion. The company combines brokerage, market intelligence tools, and social or educational features inside one platform, which can improve engagement and keep users active for longer. It has also expanded geographically and broadened product coverage over time. If the platform keeps attracting funded accounts and higher-value users, revenue can scale through both more transactions and more interest-bearing balances.
The recent growth trend is clearly stronger than the broader sector median. Revenue growth has recently run in a range of roughly 36% to 53% year over year, which is well above many established software peers. That said, longer-term earnings growth has not matched revenue progress, which means the company still needs to prove that expansion can translate into more durable operating leverage.
A meaningful catalyst is the combination of rising monetization per user and a wider product set. When active traders use margin, options, cash management, or premium tools, revenue per customer can increase without the company needing the same pace of new-user acquisition. Another important catalyst is market participation itself: periods of stronger retail trading activity often benefit platforms like Webull disproportionately.
Recent public company status and broader market visibility may also create opportunities. A listed structure can improve brand awareness, attract institutional attention, and provide more strategic flexibility for partnerships, product launches, and expansion efforts. For a consumer finance platform, credibility and scale matter, so that added visibility could support future user growth if execution remains solid.
Risks
This article is for informational purposes only and does not constitute financial advice. Some content is AI-generated. See Disclaimer


