Stock Analysis · BlackRock Technology and Private Equity Term Trust (BTX)
Overview
BlackRock Technology and Private Equity Term Trust is not an operating technology company. It is a closed-end investment trust managed by BlackRock that gives shareholders exposure to a portfolio of publicly traded technology companies and privately held growth businesses. In simple terms, BTX pools investor capital and allocates it across technology-related assets, with a structure designed to combine stock-market liquidity with access to some less liquid private investments.
Its economic performance comes mainly from changes in the value of its portfolio rather than from selling products or services in the usual corporate sense. That distinction matters for long-term analysis: BTX should be judged primarily on portfolio construction, net asset value stability, discount or premium to net asset value, fees, and the quality of BlackRock’s management rather than on traditional business expansion.
The trust’s main sources of return and income typically come from the following areas:
- Realized and unrealized gains on investments: usually the largest driver over time, coming from appreciation or declines in listed technology stocks and private equity holdings.
- Dividend and interest income from portfolio holdings: generally a smaller contribution, because technology portfolios tend to be more growth-oriented and less income-heavy than broad market funds.
- Occasional option-related or portfolio-management effects: depending on positioning, these can help or hurt results, but they are not the core long-term engine.
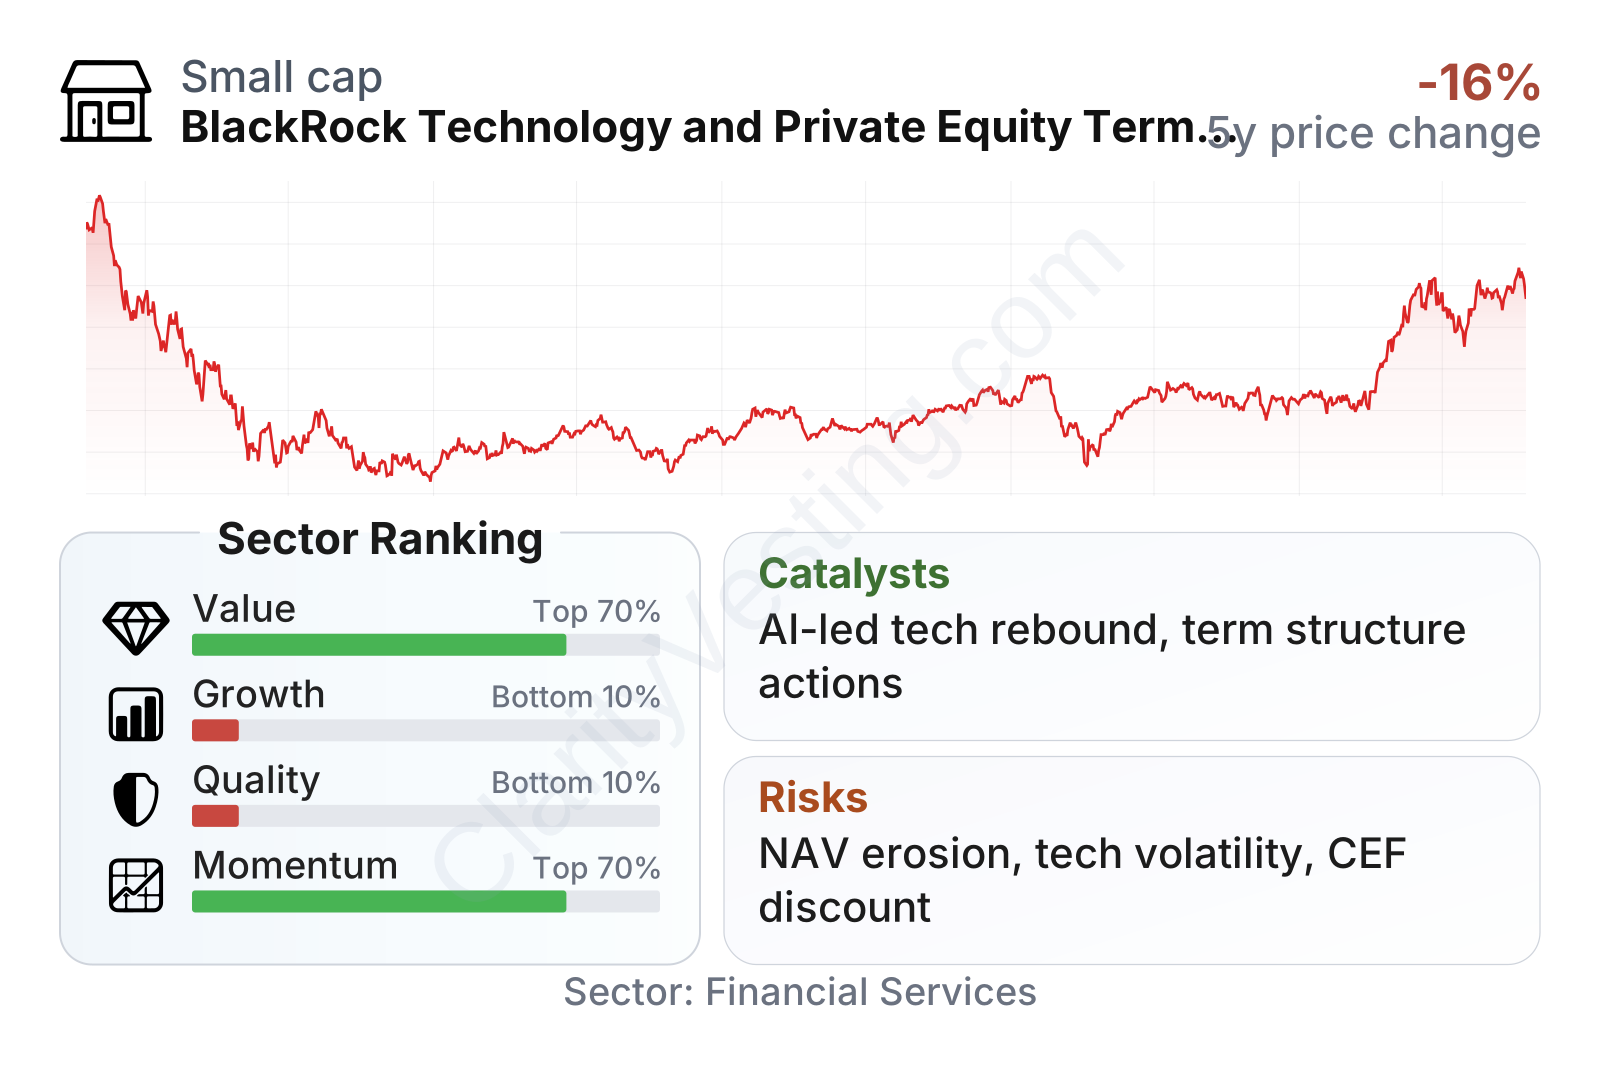
Because BTX is a fund, precise revenue percentages by business line are not as meaningful as they would be for a normal corporation. Public filings instead emphasize portfolio mix, investment gains and losses, expenses, and net asset value movement. The broad pattern in recent years shows that returns have been highly tied to market swings in technology and growth assets, with especially sharp changes during the 2022 downturn and later recovery periods.
The trust also has a term structure, meaning it was launched with a planned end date, although such vehicles can later seek shareholder approval for extensions, tender offers, or other structural adjustments. That feature can influence how the share price behaves relative to the underlying asset value, which is an important part of the long-term picture.
The long swing from deep losses in 2021 and 2022 to positive results in 2023 through 2025 reflects portfolio valuation changes more than a steady operating business model. That makes BTX more cyclical and market-sensitive than a typical asset manager or software company.
Key Figures
| Metric | Value | Sector ⓘ |
|---|---|---|
| Date | Oct 17, 2026 | |
| Context | ||
| Sector | Financial Services | |
| Industry | Asset Management | |
| Market Cap ⓘ | $1.02B | |
| Beta ⓘ | N/A | |
Value (Cheapness) | ||
| P/E Ratio ⓘ | 2.58 | 12.26 |
| P/B Ratio ⓘ | 1.11 | 1.23 |
| FCF Yield ⓘ | -1.69% | 10.40% |
| Dividend Yield ⓘ | N/A | 3.02% |
| EBIT / EV ⓘ | N/A | 8.14% |
| PEG ⓘ | N/A | |
Growth (Business expansion) | ||
| Revenue Growth ⓘ | N/A | 9.35% |
| RPS Growth (5Y CAGR) ⓘ | N/A | 12.19% |
| EPS Growth (5Y CAGR) ⓘ | N/A | -9.53% |
| BVPS Growth (5Y CAGR) ⓘ | -16.37% | 4.99% |
| Margin Growth (5Y Trend) ⓘ | -28.90% | -3.86% |
| FCF Growth (5Y CAGR) ⓘ | N/A | 4.81% |
| DPS Growth (5Y CAGR) ⓘ | 19.27% | 8.79% |
Quality (Business durability) | ||
| ROIC (Latest) ⓘ | N/A | 9.49% |
| ROE (Latest) ⓘ | -4.54% | 13.90% |
| ROA (Latest) ⓘ | -4.33% | 1.55% |
| ROIC (5Y Median) ⓘ | N/A | 7.86% |
| ROE (5Y Median) ⓘ | 0.64% | 12.17% |
| ROA (5Y Median) ⓘ | 0.63% | 1.30% |
| Net Debt / EBIT (Latest) ⓘ | N/A | 0.96 |
| Net Debt / EBIT (5Y Median) ⓘ | N/A | 0.73 |
| Net Debt / EBITDA (Latest) ⓘ | N/A | 0.92 |
| Operating Margin (Latest) ⓘ | -6899.83% | 22.30% |
| Operating Margin (5Y Median) ⓘ | 2.04% | 24.63% |
| Debt to Equity (Latest) ⓘ | N/A | 58.56% |
| Profit Margin (Latest) ⓘ | N/A | 26.57% |
| Free Cash Flow (Latest) ⓘ | -$17.34M | |
Momentum (Price trend) | ||
| 3Y Return ⓘ | +72.20% | +88.33% |
| 12M Return (excl. last month) ⓘ | +33.35% | +19.38% |
| 6M Return ⓘ | +22.44% | +4.75% |
| Price vs. 200-Day MA ⓘ | +12.76% | +3.50% |
BTX is a mid-sized listed fund with recent share-price momentum that has been stronger than much of the broader financial sector over the last 6 to 12 months. At the same time, its quality and growth rankings are weak versus sector medians, which is not surprising for a closed-end trust whose results depend heavily on marked-to-market portfolio movements. The value profile looks optically cheap on earnings, but that measure is not very reliable here because reported earnings for investment funds can swing sharply with market prices.
The share-price history also shows a major drawdown in 2022 followed by a multiyear recovery. That pattern fits the trust’s exposure to technology and private growth assets: it can participate strongly in rebounds, but it has also shown that losses can be steep when sentiment toward growth assets weakens.
Growth
BTX is exposed to one of the market’s most important long-term themes: digital infrastructure, software, semiconductors, artificial intelligence, and innovation-led private companies. On that point, the addressable sector is attractive. Technology remains one of the clearest global growth areas, and private-market innovation continues to feed future public-market leaders. If the trust’s portfolio is positioned well, that backdrop can support gains over a long period.
Its strategy also makes sense conceptually. Combining listed technology names with private equity investments can create a broader innovation portfolio than a plain public-equity fund. BlackRock’s scale, research reach, and relationships may help in sourcing and managing these exposures. For readers without a finance background, the simple version is that BTX tries to capture both mature tech leaders and earlier-stage growth opportunities in one vehicle.
That said, BTX’s own growth record has been uneven. Book value per share has trended down over the last five years, and the latest growth metrics rank near the bottom of the financial sector. This suggests the trust has not consistently compounded shareholder capital through different market environments.
Earnings per share have been volatile and at times deeply negative, which again reflects changing investment valuations more than stable business execution. For a fund like BTX, this volatility is normal to a degree, but it still highlights how dependent the trust is on favorable market conditions.
The decline in book value per share is especially important because net asset value is one of the clearest scorecards for a portfolio vehicle. A long-term vehicle tied to innovation themes can absorb short-term fluctuations, but a multiyear erosion in underlying value deserves close attention.
A practical catalyst for future improvement is continued strength in technology markets, especially in areas linked to AI infrastructure, cloud computing, and semiconductors. Another potential support is the trust’s term structure, which can create pressure over time for corporate actions intended to narrow any gap between the share price and underlying asset value. BlackRock has also continued to communicate on fund governance and shareholder outcomes through trust-related filings, which matters because structure can be almost as important as portfolio selection in closed-end funds.
Risks
This article is for informational purposes only and does not constitute financial advice. Some content is AI-generated. See Disclaimer


