Stock Analysis · Peabody Energy Corp (BTU)
Overview
Peabody Energy Corp is a coal producer and marketer. It sells two main types of coal: seaborne metallurgical coal, which is used mainly in steelmaking, and thermal coal, which is used primarily to generate electricity. The company operates mines in the United States and Australia and sells into both domestic and export markets. That mix gives Peabody exposure to several different demand centers: U.S. power generation, global steel production, and Asian coal-import markets.
Based on the company’s recent annual reporting, revenue is mainly generated from coal sales across four operating segments. The business mix can shift from year to year because coal prices are highly cyclical, but the latest full-year picture points to the following approximate breakdown:
- Seaborne Thermal coal: about 30%–35% — Coal exported mainly for power generation, with a large share linked to Asian demand.
- Powder River Basin: about 25%–30% — Low-sulfur thermal coal mined in Wyoming and sold mostly to U.S. electric utilities.
- Seaborne Metallurgical coal: about 20%–25% — Higher-grade coal used in blast-furnace steelmaking, largely exported from Australia.
- Other U.S. Thermal coal: about 15%–20% — Includes thermal coal from additional U.S. mining regions serving domestic power customers and industrial users.
That revenue mix matters because Peabody is not a pure U.S. utility-coal company. Export markets, especially seaborne thermal and metallurgical coal, can materially change earnings depending on international prices, shipping economics, and steel demand.
The multi-year financial pattern also shows how cyclical this business can be. Revenue and profits surged in 2022 and remained strong in 2023, then softened in 2024 and weakened sharply in 2025 as margins compressed. In other words, Peabody’s operating results have been driven much more by coal-price swings than by steady, predictable volume growth.
The profit flow illustrates that clearly: gross profit and operating income were exceptionally strong in 2022 and 2023, but much thinner by 2024 and especially 2025. Interest expense has come down over the same period, which is a positive sign for balance-sheet repair, but lower financing costs did not offset the decline in coal market conditions.
Key Figures
| Metric | Value | Sector ⓘ |
|---|---|---|
| Date | Oct 17, 2026 | |
| Context | ||
| Sector | Energy | |
| Industry | Thermal Coal | |
| Market Cap ⓘ | $3.07B | |
| Beta ⓘ | 0.32 | |
Value (Cheapness) | ||
| P/E Ratio ⓘ | N/A | 15.44 |
| P/B Ratio ⓘ | 0.89 | 1.73 |
| FCF Yield ⓘ | 14.72% | 8.20% |
| Dividend Yield ⓘ | 1.20% | 3.59% |
| EBIT / EV ⓘ | -4.96% | 7.46% |
| PEG ⓘ | N/A | |
Growth (Business expansion) | ||
| Revenue Growth ⓘ | 12.70% | 26.90% |
| RPS Growth (5Y CAGR) ⓘ | 1.71% | 6.90% |
| EPS Growth (5Y CAGR) ⓘ | N/A | -15.73% |
| BVPS Growth (5Y CAGR) ⓘ | 17.17% | 6.07% |
| Margin Growth (5Y Trend) ⓘ | -16.41% | 0.58% |
| FCF Growth (5Y CAGR) ⓘ | 22.20% | 1.86% |
| DPS Growth (5Y CAGR) ⓘ | N/A | 16.79% |
Quality (Business durability) | ||
| ROIC (Latest) ⓘ | -3.39% | 11.40% |
| ROA (Latest) ⓘ | -3.26% | 6.06% |
| ROIC (5Y Median) ⓘ | 19.32% | 10.30% |
| ROA (5Y Median) ⓘ | 7.49% | 5.42% |
| Net Debt / EBIT (Latest) ⓘ | N/A | 1.64 |
| Net Debt / EBIT (5Y Median) ⓘ | -0.48 | 1.83 |
| Net Debt / EBITDA (Latest) ⓘ | -0.36 | 1.08 |
| Net Debt / Assets ⓘ | -1.86% | 17.29% |
| EBITDA / Interest ⓘ | 6.36 | 9.64 |
| Operating Margin (Latest) ⓘ | -3.85% | 16.27% |
| Operating Margin (5Y Median) ⓘ | 16.68% | 20.39% |
| Debt to Equity (Latest) ⓘ | 13.08% | 54.76% |
| Profit Margin (Latest) ⓘ | -4.56% | 8.82% |
| Free Cash Flow (Latest) ⓘ | $452.50M | |
Momentum (Price trend) | ||
| 3Y Return ⓘ | -5.13% | +67.38% |
| 12M Return (excl. last month) ⓘ | +50.19% | +49.19% |
| 6M Return ⓘ | -14.75% | +7.07% |
| Price vs. 200-Day MA ⓘ | -17.72% | +9.56% |
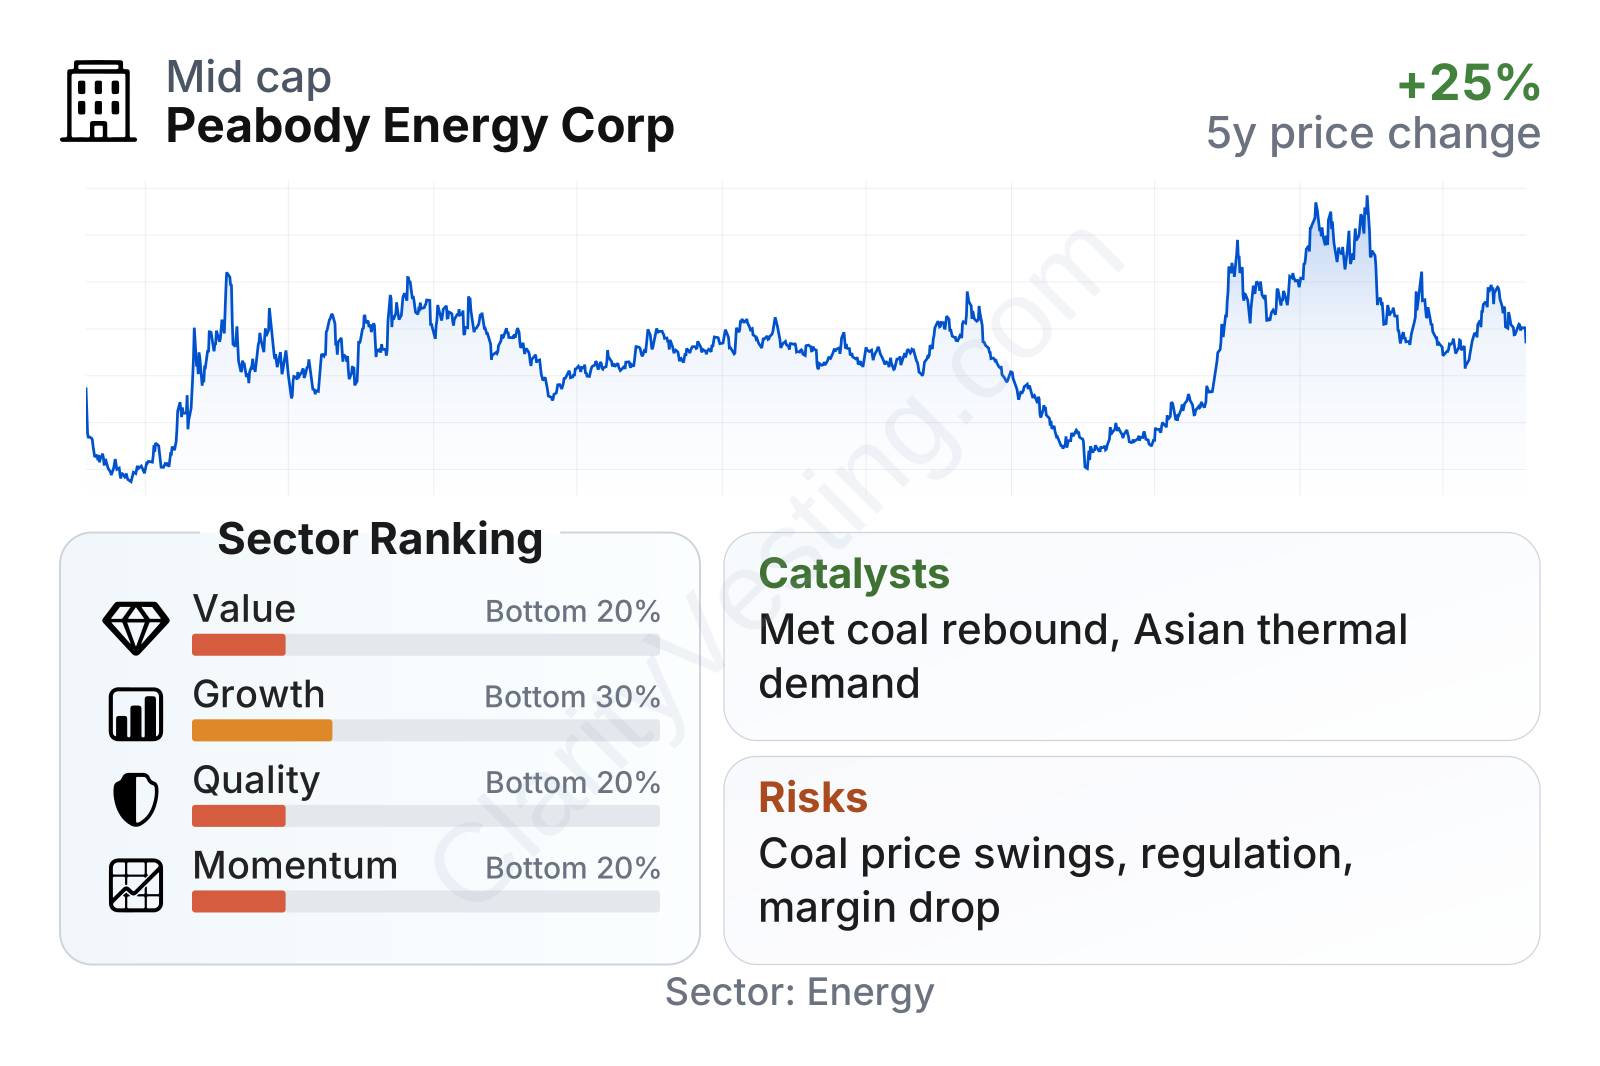
Peabody is a mid-sized energy company by market value. The table points to a business with very low leverage compared with much of the sector, which is one of its clearest financial strengths. It also shows that recent profitability and growth measures rank near the lower end of the energy group, reflecting the downturn in earnings over the last year. Valuation signals are mixed: the stock trades below sector norms on book value and shows a strong free-cash-flow yield, but current EBIT-based measures are distorted by weaker recent operating performance. Momentum is also uneven, with a strong longer 12-month rebound but weaker shorter-term trading and a share price sitting below its 200-day average.
Growth
Peabody operates in a sector with a complicated long-term outlook. Coal is not a broad secular growth industry in most developed markets because utilities continue shifting toward natural gas, renewables, and lower-emission power sources. However, that does not mean every part of Peabody’s business is in structural decline at the same speed. Metallurgical coal still plays a role in conventional steelmaking, and seaborne thermal coal can remain relevant in parts of Asia where coal-fired generation is still a major part of the power mix.
For that reason, Peabody’s strategy is less about expanding into a fast-growing industry and more about managing a cyclical resource portfolio efficiently, prioritizing low-cost operations, preserving cash, and directing production toward markets with stronger pricing. The company’s Australian assets are especially important here because they provide access to export markets rather than relying only on U.S. domestic utility demand, which is under longer-term pressure.
Recent sales trends show how quickly conditions can change. After exceptional growth during the coal-price spike of 2022 and early 2023, revenue growth turned negative for much of 2023 through 2025 before returning to positive territory in 2026. That rebound is encouraging, but it is still modest compared with earlier peak-cycle conditions, which suggests recovery rather than a full return to boom-level fundamentals.
Cash generation tells a similar story. Free cash flow reached an unusually high level in the upcycle, then normalized sharply. Even after that decline, Peabody has remained cash generative on a trailing basis, which is important because cash can support mine investment, shareholder returns, and balance-sheet resilience without relying heavily on new debt.
A practical catalyst for future performance is any sustained improvement in seaborne coal pricing, especially metallurgical coal tied to steel demand and export thermal coal tied to Asian imports. Another catalyst is operational execution: when a coal producer enters a better pricing environment with a cleaner balance sheet, a larger share of the benefit can flow through to equity holders. Recent company communications have also continued to emphasize capital returns and disciplined spending, which matters in a cyclical industry where overexpansion during good times often destroys value later.
Risks
This article is for informational purposes only and does not constitute financial advice. Some content is AI-generated. See Disclaimer


