Stock Analysis · Braveheart Bio Inc (BRVE)
Overview
Braveheart Bio Inc is a biotechnology company in the healthcare sector. Based on the available public financial information, it appears to be an early-stage or pre-commercial business focused on developing drug candidates rather than selling established products at scale. That matters for long-term analysis because companies at this stage are usually valued more on their pipeline, clinical progress, regulatory milestones, and financing capacity than on current sales or earnings.
The latest available annual figures indicate that the company generated no revenue during the reported period. In practical terms, this suggests the business is still in the development phase and is not yet supported by recurring commercial income.
- Product revenue: 0% reported for the latest annual period, indicating no marketed product sales were recorded.
- Collaboration, licensing, or milestone revenue: no meaningful amount disclosed in the latest annual figures available here.
- Other revenue: no meaningful amount disclosed in the latest annual figures available here.
The operating cost base is still meaningful despite the lack of sales. The latest annual profile shows operating expenses mainly split between selling, general and administrative expense and research and development expense. That mix can be unusual for a development-stage biotech, because investors often expect research spending to dominate clearly. It may reflect corporate overhead, listing-related costs, or transition expenses, but it also means the company’s future value creation still depends on converting spending into credible clinical and strategic progress.
The broad financial picture is straightforward: no revenue, negative operating income, negative net income, and negative free cash flow. For a biotech, this is not automatically a sign of failure, but it does mean the investment case depends heavily on whether the company can advance programs into value-creating milestones before additional funding is needed.
The cost structure currently shows a business funding operations without offsetting revenue. The key takeaway is that Braveheart Bio is still an execution-driven biotech rather than a financially self-sustaining healthcare company.
Key Figures
| Metric | Value | Sector ⓘ |
|---|---|---|
| Date | Oct 03, 2026 | |
| Context | ||
| Sector | Healthcare | |
| Industry | Biotechnology | |
| Market Cap ⓘ | $1.82B | |
| Beta ⓘ | N/A | |
Value (Cheapness) | ||
| P/E Ratio ⓘ | N/A | 24.06 |
| P/B Ratio ⓘ | N/A | 3.08 |
| FCF Yield ⓘ | -1.38% | 3.07% |
| Dividend Yield ⓘ | N/A | 2.05% |
| EBIT / EV ⓘ | -1.71% | 0.63% |
| PEG ⓘ | N/A | |
Growth (Business expansion) | ||
| Revenue Growth ⓘ | N/A | 7.50% |
| RPS Growth (5Y CAGR) ⓘ | N/A | 8.70% |
| EPS Growth (5Y CAGR) ⓘ | N/A | -18.20% |
| BVPS Growth (5Y CAGR) ⓘ | N/A | 3.95% |
| Margin Growth (5Y Trend) ⓘ | N/A | -0.58% |
| FCF Growth (5Y CAGR) ⓘ | N/A | 0.88% |
| DPS Growth (5Y CAGR) ⓘ | N/A | 6.80% |
Quality (Business durability) | ||
| ROIC (Latest) ⓘ | N/A | 3.29% |
| ROA (Latest) ⓘ | N/A | 3.02% |
| ROIC (5Y Median) ⓘ | N/A | 4.75% |
| ROA (5Y Median) ⓘ | N/A | 1.93% |
| Net Debt / EBIT (Latest) ⓘ | N/A | 1.33 |
| Net Debt / EBIT (5Y Median) ⓘ | N/A | 1.83 |
| Net Debt / EBITDA (Latest) ⓘ | N/A | 0.99 |
| Net Debt / Assets ⓘ | N/A | 5.33% |
| EBITDA / Interest ⓘ | N/A | 9.63 |
| Operating Margin (Latest) ⓘ | N/A | 9.25% |
| Operating Margin (5Y Median) ⓘ | N/A | 7.80% |
| Debt to Equity (Latest) ⓘ | N/A | 28.99% |
| Profit Margin (Latest) ⓘ | N/A | 3.60% |
| Free Cash Flow (Latest) ⓘ | -$25.16M | |
Momentum (Price trend) | ||
| 3Y Return ⓘ | N/A | +37.48% |
| 12M Return (excl. last month) ⓘ | N/A | +20.85% |
| 6M Return ⓘ | N/A | +9.73% |
| Price vs. 200-Day MA ⓘ | N/A | +4.69% |
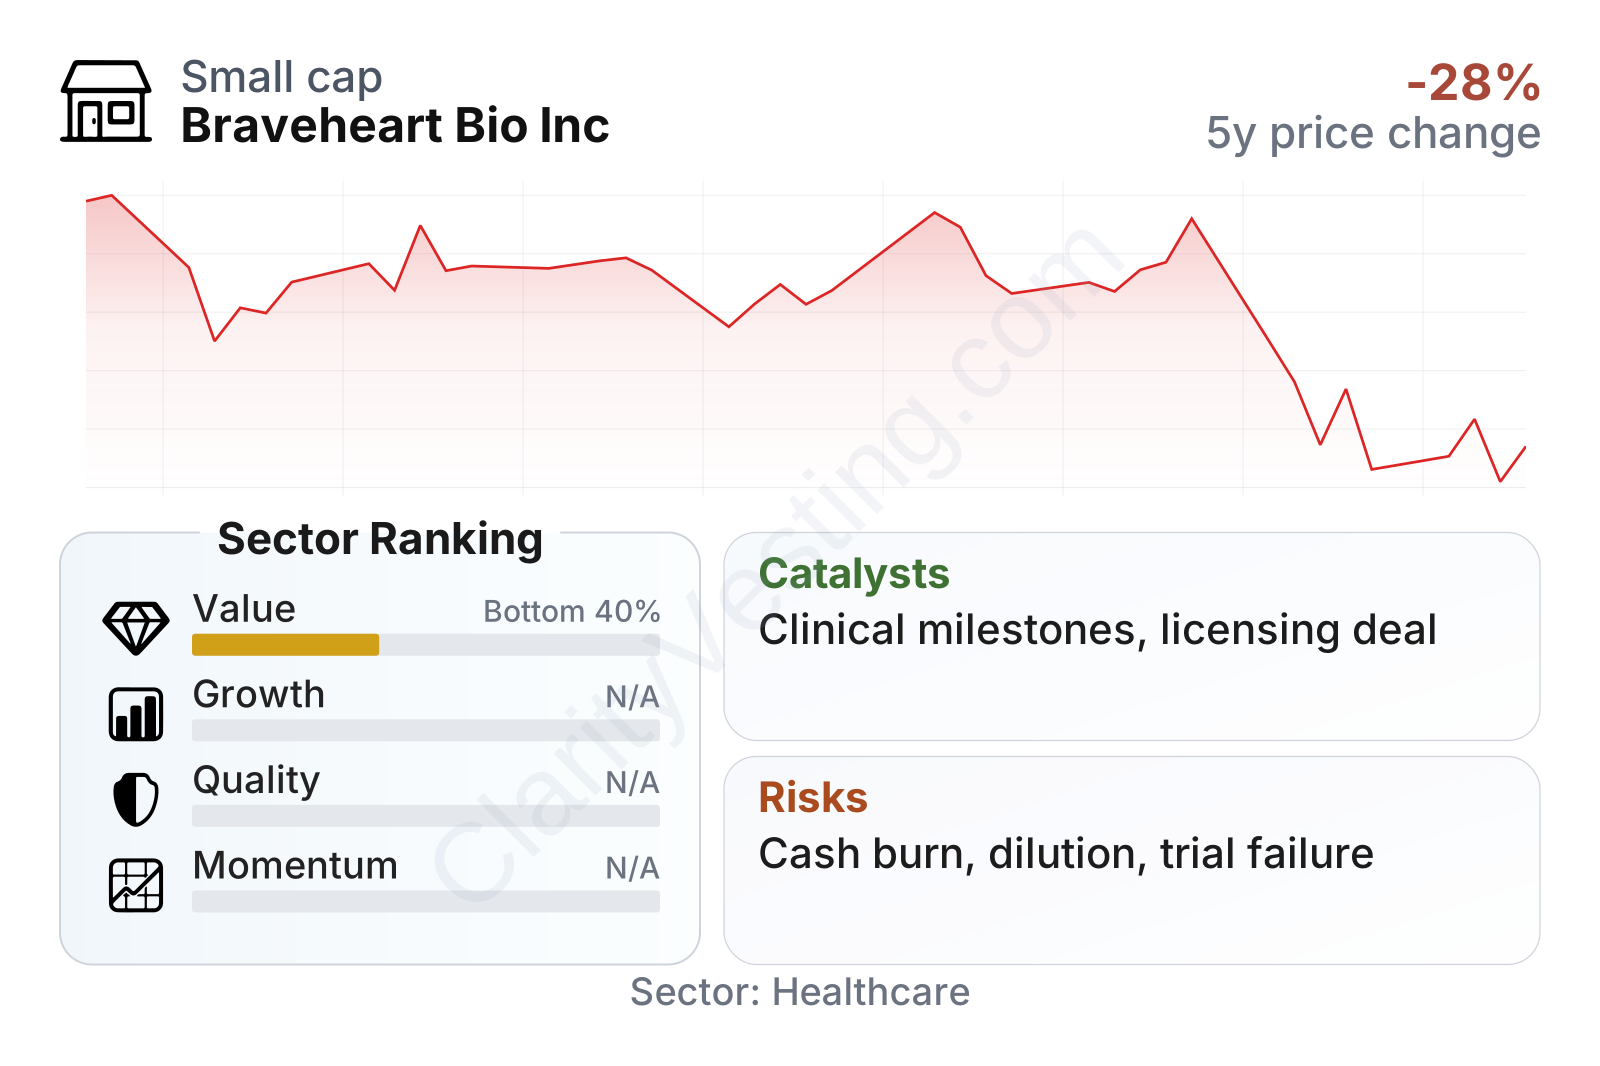
Braveheart Bio is a small-cap biotech, with a market value around $2 billion based on the latest snapshot. The overall profile is still difficult to judge through traditional valuation ratios because there is no revenue, profitability is absent, and cash generation is negative. That is why several growth and quality indicators are not especially informative yet, while the value profile ranks in the lower part of the healthcare sector.
Two points stand out. First, free cash flow remains negative, which is common in development-stage biotechnology but still important because it raises the probability of future capital needs. Second, revenue growth is effectively 0% in the latest period, reinforcing that this is not yet a commercialization case. In other words, the numbers describe a company whose market value is tied mainly to future expectations rather than present operating performance.
Growth
Biotechnology remains a sector with long-term structural support. Aging populations, demand for better therapies, advances in precision medicine, and the willingness of large pharmaceutical companies to acquire or partner with promising smaller developers all create room for significant upside when a company produces strong clinical evidence. That said, this is also one of the most binary areas of the market: growth can accelerate quickly after a positive milestone, but it can also stall abruptly after a setback.
For Braveheart Bio, the growth case appears to rest almost entirely on pipeline advancement and corporate execution rather than on existing demand trends. Since the company has no reported revenue, the central question is whether its programs can move from development into stages that attract partners, regulatory momentum, or eventual commercialization. If management can produce strong trial data, secure licensing agreements, or clarify a path to market, the business profile could change materially.
The current strategy can make sense for future growth if the company is building differentiated assets in areas of unmet medical need. In biotech, a single successful candidate can reshape the economics of the entire company. The strongest catalysts therefore are likely to be clinical readouts, regulatory interactions, licensing deals, and any evidence that external partners validate the science.
At the same time, the available financial picture does not yet show proof of operating traction. That means the growth narrative is still prospective rather than demonstrated. For long-term analysis, this places more weight on program quality, management discipline, and the timing of milestones than on conventional business expansion metrics.
Risks
This article is for informational purposes only and does not constitute financial advice. Some content is AI-generated. See Disclaimer


