Stock Analysis · Brown & Brown Inc (BRO)
Overview
Brown & Brown is a large insurance brokerage and risk services company. It does not operate like a traditional insurer that takes underwriting risk on a large balance sheet. Instead, it mainly acts as an intermediary: it helps businesses, individuals, and public entities find insurance coverage, employee benefits solutions, and related services, then earns commissions and fees for placing and servicing those policies.
The company organizes its operations into several segments. Based on its latest annual reporting structure, revenue is primarily generated from the Retail segment, followed by Programs, Wholesale Brokerage, and National Programs. Those categories can shift modestly over time as acquisitions are integrated, but the ranking is stable.
- Retail: approximately 55% to 60% of revenue. This is the largest activity and includes direct sales of property and casualty insurance, employee benefits, personal lines, and related advisory services to commercial and individual clients.
- Programs: approximately 15% to 20% of revenue. This segment includes specialized insurance programs, often built around niche industries or affinity groups, where Brown & Brown provides distribution and administrative capabilities.
- Wholesale Brokerage: approximately 15% to 20% of revenue. This business serves retail agencies by helping place more complex or hard-to-place coverage with insurers and excess and surplus lines carriers.
- National Programs: approximately 10% to 15% of revenue. This segment focuses on broader program administration, specialized products, and services delivered on a larger scale.
Its revenue mix is attractive for a long-term business model because insurance brokerage tends to be recurring, asset-light, and cash generative. The company benefits from policy renewals, ongoing client service work, and acquisitions that add new books of business. Over the last several years, total revenue, operating income, and net income have all expanded materially, while margins have remained solid for the industry.
The overall financial flow also shows a favorable pattern: revenue has risen sharply since 2021, operating profit has grown along with it, and free cash generation remains strong. Interest expense has also increased, which matters because acquisitions have been an important part of expansion.
Key Figures
| Metric | Value | Sector ⓘ |
|---|---|---|
| Date | Oct 17, 2026 | |
| Context | ||
| Sector | Financial Services | |
| Industry | Insurance Brokers | |
| Market Cap ⓘ | $21.68B | |
| Beta ⓘ | 0.59 | |
Value (Cheapness) | ||
| P/E Ratio ⓘ | 20.19 | 12.26 |
| P/B Ratio ⓘ | 1.84 | 1.23 |
| FCF Yield ⓘ | 6.67% | 10.40% |
| Dividend Yield ⓘ | 1.01% | 3.02% |
| EBIT / EV ⓘ | 6.97% | 8.14% |
| PEG ⓘ | 1.51 | |
Growth (Business expansion) | ||
| Revenue Growth ⓘ | 32.40% | 9.35% |
| RPS Growth (5Y CAGR) ⓘ | 13.78% | 12.19% |
| EPS Growth (5Y CAGR) ⓘ | 1.93% | -9.53% |
| BVPS Growth (5Y CAGR) ⓘ | 27.52% | 4.99% |
| Margin Growth (5Y Trend) ⓘ | -2.16% | -3.86% |
| FCF Growth (5Y CAGR) ⓘ | 11.23% | 4.81% |
| DPS Growth (5Y CAGR) ⓘ | 12.54% | 8.79% |
Quality (Business durability) | ||
| ROIC (Latest) ⓘ | 7.44% | 9.49% |
| ROE (Latest) ⓘ | 9.63% | 13.90% |
| ROA (Latest) ⓘ | 4.07% | 1.55% |
| ROIC (5Y Median) ⓘ | 10.86% | 7.86% |
| ROE (5Y Median) ⓘ | 14.97% | 12.17% |
| ROA (5Y Median) ⓘ | 6.03% | 1.30% |
| Net Debt / EBIT (Latest) ⓘ | 3.67 | 0.96 |
| Net Debt / EBIT (5Y Median) ⓘ | 2.60 | 0.73 |
| Net Debt / EBITDA (Latest) ⓘ | 2.91 | 0.92 |
| Operating Margin (Latest) ⓘ | 28.20% | 22.30% |
| Operating Margin (5Y Median) ⓘ | 29.98% | 24.63% |
| Debt to Equity (Latest) ⓘ | 63.63% | 58.56% |
| Profit Margin (Latest) ⓘ | 18.08% | 26.57% |
| Free Cash Flow (Latest) ⓘ | $1.45B | |
Momentum (Price trend) | ||
| 3Y Return ⓘ | -0.47% | +88.33% |
| 12M Return (excl. last month) ⓘ | -25.31% | +19.38% |
| 6M Return ⓘ | +1.39% | +4.75% |
| Price vs. 200-Day MA ⓘ | +1.58% | +3.50% |
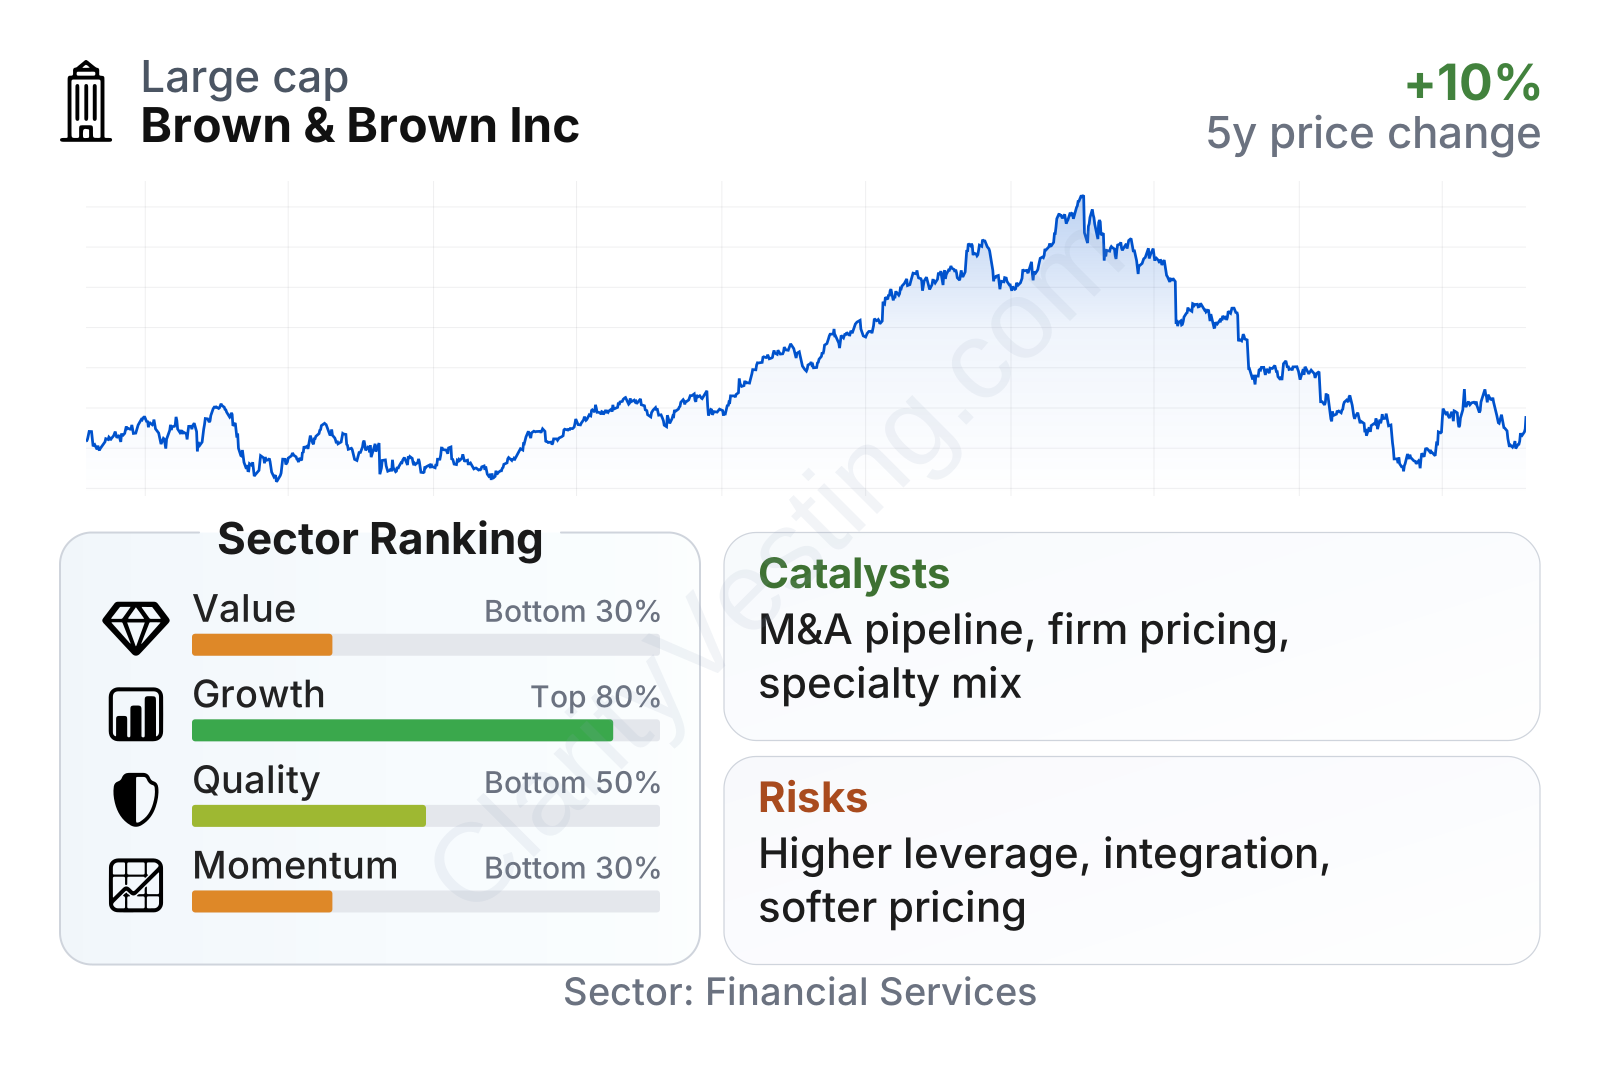
Brown & Brown is a large-cap insurance broker with a relatively low beta of about 0.58, meaning its share price has historically moved less than the broader market. On growth, the company stands well above much of its sector: recent revenue growth is far ahead of the sector median, five-year revenue per share growth has been healthy, and free cash flow as well as dividends have compounded at a good pace. Quality is more mixed. Operating margins are stronger than the sector median, and long-term returns on capital have been solid, but leverage is clearly higher than many peers and current return on equity sits below the sector median. On valuation, the stock still screens richer than much of the sector on earnings and book value multiples, even after a sizable price decline. Momentum is the weakest area, with recent share-price performance trailing the sector by a wide margin.
The share-price history reflects that contrast well: the stock had a powerful run through 2024 and into part of 2025, then gave back a meaningful portion of those gains into 2026. That reset has reduced the premium, but it has not erased it completely.
Growth
Brown & Brown operates in a sector that generally benefits from durable long-term demand. Insurance is not optional for most businesses and many households, and rising economic activity, payrolls, asset values, litigation risk, and regulatory complexity all tend to support continued need for brokerage services. In addition, the insurance distribution market remains fragmented, which creates room for consolidators to expand through acquisitions.
That industry setup fits Brown & Brown’s strategy well. The company has a long record of buying smaller brokerages and specialty platforms, then using its scale, insurer relationships, and cross-selling ability to improve growth. This approach makes strategic sense because insurance broking can absorb acquisitions without large capital spending needs, and recurring commissions can make acquired revenue relatively sticky.
The company’s growth profile has remained strong. Revenue growth recently ran at roughly 32% year over year, far above the sector median. Over a five-year period, revenue per share compounded in the mid-teens, while free cash flow grew at a double-digit annual pace. Book value per share growth has been especially strong, helped by earnings retention and deal activity.
Earnings per share have trended higher over the last several years, rising from a little above $2 in 2021 to above $4 in 2025. That progression supports the idea that expansion has not been driven only by headline revenue, but also by bottom-line scaling.
Book value per share also moved up sharply, with a particularly large step-up in the most recent period. That can indicate accretive growth and balance-sheet expansion, although sharp changes should also be read alongside acquisition accounting and debt usage rather than treated as purely organic improvement.
A notable catalyst is the company’s ability to keep consolidating a fragmented market while also benefiting from firmer insurance pricing in many commercial lines. When premiums rise, brokers often collect higher commissions even without taking underwriting risk themselves. Another supportive factor is Brown & Brown’s broad presence across retail, wholesale, specialty programs, and benefits, which gives it multiple ways to capture client demand.
Recent company communications have continued to emphasize acquisition activity, integration, and specialty expansion as important drivers. For a broker of this size, a steady pipeline of tuck-in deals and selective larger transactions remains one of the clearest growth opportunities.
Risks
This article is for informational purposes only and does not constitute financial advice. Some content is AI-generated. See Disclaimer


