Stock Analysis · British Land Company Plc (BRLAF)
Overview
British Land Company Plc is one of the large listed property owners and developers in the United Kingdom. It focuses on owning, managing, and redeveloping commercial real estate, with a portfolio centered on London campuses, retail parks, and urban logistics assets. In simple terms, it makes money mainly by renting space to businesses and retailers, while also trying to increase the value of its properties through redevelopment, active asset management, and selective acquisitions and disposals.
The business has become more focused in recent years. Older parts of the portfolio, especially traditional shopping center exposure, have been reduced, while management has put more weight on mixed-use London locations and retail parks that serve everyday shopping needs. The company has also been building its presence in logistics, a segment linked to e-commerce and supply chain demand.
Based on the latest annual reporting, British Land’s rental income is primarily generated from a few major property groups.
- Campuses and central London offices: approximately 45% to 50% of property income. This includes large mixed-use campuses such as Broadgate, Paddington Central, and Regent’s Place, where office space is combined with retail, food, and other uses.
- Retail parks: approximately 30% to 35% of property income. These are open-air retail destinations typically occupied by supermarkets, discount chains, home improvement stores, and other retailers that benefit from car access and lower occupancy costs than city-center malls.
- Urban logistics and distribution: approximately 10% to 15% of property income. These assets are used for warehousing and last-mile distribution, supporting delivery networks near major population centers.
- Other retail and remaining assets: approximately 5% to 10% of property income. This includes smaller or non-core assets and income from parts of the portfolio being repositioned or sold over time.
Because British Land is a property company, reported profit can swing sharply from year to year as property values move up or down, even when rents are relatively stable. That is why rental growth, occupancy, leasing activity, and balance-sheet strength usually matter more than one year’s headline earnings.
The recent pattern shows that revenue recovered strongly after weaker years, while administrative costs stayed relatively controlled. Profitability has also been heavily influenced by property valuation movements and financing costs, which is typical for listed real estate groups.
Key Figures
| Metric | Value | Sector ⓘ |
|---|---|---|
| Date | Oct 17, 2026 | |
| Context | ||
| Sector | Real Estate | |
| Industry | REIT - Diversified | |
| Market Cap ⓘ | $5.32B | |
| Beta ⓘ | 1.18 | |
Value (Cheapness) | ||
| P/E Ratio ⓘ | 8.51 | 17.38 |
| P/B Ratio ⓘ | 0.88 | 0.85 |
| FCF Yield ⓘ | 8.56% | 7.38% |
| Dividend Yield ⓘ | 4.45% | 4.85% |
| EBIT / EV ⓘ | N/A | 3.78% |
| PEG ⓘ | 6.76 | |
Growth (Business expansion) | ||
| Revenue Growth ⓘ | 6.90% | 5.30% |
| RPS Growth (5Y CAGR) ⓘ | 1.34% | 6.02% |
| EPS Growth (5Y CAGR) ⓘ | -6.43% | -11.37% |
| BVPS Growth (5Y CAGR) ⓘ | -11.21% | 0.45% |
| Margin Growth (5Y Trend) ⓘ | -171.57% | -0.22% |
| FCF Growth (5Y CAGR) ⓘ | N/A | 5.40% |
| DPS Growth (5Y CAGR) ⓘ | 0.98% | 5.02% |
Quality (Business durability) | ||
| ROIC (Latest) ⓘ | N/A | 5.69% |
| ROE (Latest) ⓘ | 14.08% | 7.56% |
| ROA (Latest) ⓘ | 8.97% | 2.85% |
| ROIC (5Y Median) ⓘ | 4.57% | 4.22% |
| ROE (5Y Median) ⓘ | 6.15% | 6.03% |
| ROA (5Y Median) ⓘ | 4.01% | 2.44% |
| Net Debt / EBIT (Latest) ⓘ | N/A | 7.59 |
| Net Debt / EBIT (5Y Median) ⓘ | 5.63 | 8.40 |
| Net Debt / EBITDA (Latest) ⓘ | 3.78 | 5.27 |
| Net Debt / Assets ⓘ | 31.21% | 37.76% |
| EBITDA / Interest ⓘ | 3.34 | 4.10 |
| Operating Margin (Latest) ⓘ | N/A | 35.29% |
| Operating Margin (5Y Median) ⓘ | 65.52% | 37.31% |
| Debt to Equity (Latest) ⓘ | 52.21% | 88.87% |
| Profit Margin (Latest) ⓘ | 73.70% | 19.61% |
| Free Cash Flow (Latest) ⓘ | $455.24M | |
Momentum (Price trend) | ||
| 3Y Return ⓘ | +61.65% | +30.75% |
| 12M Return (excl. last month) ⓘ | +30.50% | +4.36% |
| 6M Return ⓘ | -7.65% | -2.52% |
| Price vs. 200-Day MA ⓘ | +4.70% | -2.34% |
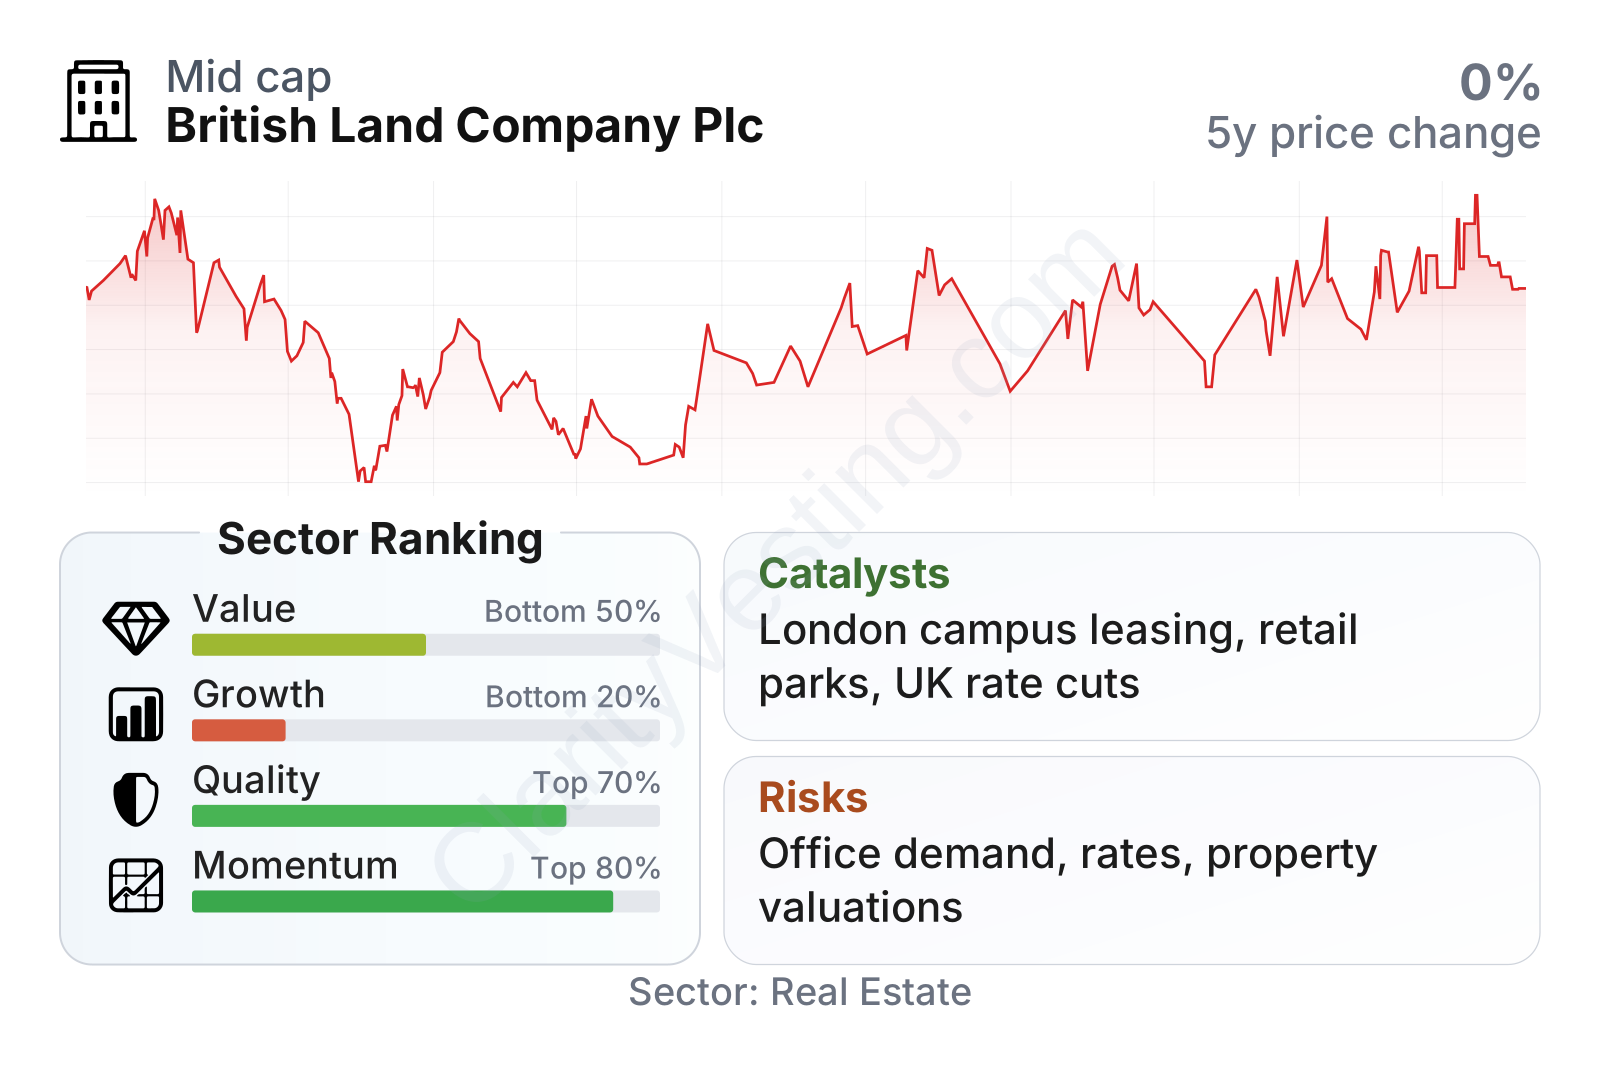
British Land sits in the middle to lower end of the sector on pure valuation measures, but the picture is more nuanced than a simple low-multiple reading. Its earnings multiple is below the sector median, price-to-book is roughly in line with peers, and free cash flow yield looks comparatively solid. Quality metrics are generally respectable, with debt levels lower than many diversified real estate peers and returns on assets and equity above sector medians. The weaker area is growth: long-term revenue per share and book value per share trends have been modest to negative, which helps explain why the market has not assigned a richer valuation. Share price momentum, however, has improved meaningfully versus much of the sector over the last several years.
Growth
British Land operates in parts of real estate that have mixed long-term outlooks rather than one single rising trend. Traditional offices remain a challenged segment in many markets because hybrid work has reduced demand for lower-quality buildings. But the opposite is often true for prime offices in central locations with strong amenities and sustainability credentials. British Land’s strategy is aimed at that more resilient end of the office market. Its London campuses are designed to attract large employers that still want high-quality space in well-connected areas.
Retail parks are another important growth angle. This format has been more resilient than enclosed malls in the UK because rents are generally lower, access is easier, and tenants often sell essential or value-oriented goods. In a slower consumer environment, this positioning can matter. The company has also been increasing exposure to urban logistics, which adds a structural growth element tied to e-commerce, inventory management, and demand for delivery infrastructure near cities.
Revenue per share has been uneven rather than consistently compounding. There was a strong rebound in the middle of the period, but the most recent levels suggest the company is still working through portfolio reshaping rather than delivering smooth top-line expansion. That supports the view that British Land’s growth case depends more on better asset mix and future development gains than on straightforward year-after-year rental growth.
The dividend record also reflects this transitional phase. The payout recovered after earlier disruption, then softened again more recently. For a long-term view, this suggests income capacity exists, but it remains linked to property market conditions, capital allocation priorities, and the pace of redevelopment spending.
A meaningful catalyst is the continued shift toward higher-quality campuses and retail parks, combined with selective development projects. If leasing demand remains firm in prime London locations and logistics keeps scaling, earnings quality could improve. Another positive factor is that falling or stabilizing interest rates in the UK property market could support valuations, transaction activity, and financing conditions. Recent company updates have also highlighted active leasing and ongoing investment into major campuses, which points to management still seeing demand for well-located, modern space.
Risks
This article is for informational purposes only and does not constitute financial advice. Some content is AI-generated. See Disclaimer


