Stock Analysis · Bruker Corporation (BRKR)
Overview
Bruker Corporation is a scientific instruments and analytical tools company that sells equipment, software, consumables, and services used in life sciences, pharmaceutical research, diagnostics, biotechnology, materials analysis, and industrial quality control. In simple terms, Bruker helps laboratories and industrial customers measure, identify, and analyze molecules, cells, tissues, and materials with high precision.
The company’s business is spread across several instrument families rather than a single product line. Based on recent company reporting, revenue is mainly generated from the following segments, listed from largest to smallest:
- Bruker Scientific Instruments (BSI): about 74% of revenue — This is the core business and includes mass spectrometry, magnetic resonance, chromatography, microscopy, elemental analysis, and other high-end analytical systems used by research and industrial labs.
- Bruker Energy & Supercon Technologies (BEST): about 14% of revenue — This segment includes superconducting materials and devices, as well as energy-related technologies that support advanced research and industrial applications.
- Bruker BioSpin Group: about 12% of revenue — This unit focuses on nuclear magnetic resonance, preclinical imaging, and related technologies used in structural biology, translational research, and advanced imaging workflows.
Across these businesses, Bruker also benefits from recurring revenue streams such as service contracts, maintenance, software, and consumables. Those activities are smaller than instrument sales, but they are important because they tend to be steadier and can support customer retention over long product cycles.
Bruker is a mid-sized healthcare tools company by stock market value, but its actual end-markets are broad and global. Its instruments are often deeply embedded in customer workflows, which can create long replacement cycles and sticky relationships once systems are installed.
The long-term pattern has been solid revenue expansion, rising from roughly $2.4 billion in 2021 to about $3.4 billion in 2025. The weaker point is profitability: operating income and net income fell sharply in 2024 and 2025 even as sales kept growing, showing that recent expansion and cost pressure have weighed on earnings quality.
Key Figures
| Metric | Value | Sector ⓘ |
|---|---|---|
| Date | Oct 17, 2026 | |
| Context | ||
| Sector | Healthcare | |
| Industry | Medical Devices | |
| Market Cap ⓘ | $8.47B | |
| Beta ⓘ | 1.22 | |
Value (Cheapness) | ||
| P/E Ratio ⓘ | N/A | 24.79 |
| P/B Ratio ⓘ | 3.67 | 3.08 |
| FCF Yield ⓘ | 1.11% | 3.15% |
| Dividend Yield ⓘ | 0.36% | 1.94% |
| EBIT / EV ⓘ | 0.16% | 0.57% |
| PEG ⓘ | 1.52 | |
Growth (Business expansion) | ||
| Revenue Growth ⓘ | 5.20% | 7.45% |
| RPS Growth (5Y CAGR) ⓘ | 9.38% | 8.61% |
| EPS Growth (5Y CAGR) ⓘ | -24.90% | -17.81% |
| BVPS Growth (5Y CAGR) ⓘ | 23.03% | 3.72% |
| Margin Growth (5Y Trend) ⓘ | -14.48% | -0.62% |
| FCF Growth (5Y CAGR) ⓘ | -48.02% | 1.04% |
| DPS Growth (5Y CAGR) ⓘ | -1.30% | 6.77% |
Quality (Business durability) | ||
| ROIC (Latest) ⓘ | -0.26% | 3.24% |
| ROA (Latest) ⓘ | -1.14% | 3.01% |
| ROIC (5Y Median) ⓘ | 12.99% | 4.60% |
| ROA (5Y Median) ⓘ | 8.17% | 1.89% |
| Net Debt / EBIT (Latest) ⓘ | 98.34 | 1.34 |
| Net Debt / EBIT (5Y Median) ⓘ | 1.59 | 1.84 |
| Net Debt / EBITDA (Latest) ⓘ | 6.99 | 1.00 |
| Net Debt / Assets ⓘ | 28.59% | 5.45% |
| EBITDA / Interest ⓘ | 4.03 | 9.64 |
| Operating Margin (Latest) ⓘ | 0.50% | 9.27% |
| Operating Margin (5Y Median) ⓘ | 16.87% | 7.38% |
| Debt to Equity (Latest) ⓘ | 79.81% | 28.58% |
| Profit Margin (Latest) ⓘ | -2.04% | 3.59% |
| Free Cash Flow (Latest) ⓘ | $93.90M | |
Momentum (Price trend) | ||
| 3Y Return ⓘ | -8.57% | +42.80% |
| 12M Return (excl. last month) ⓘ | +74.70% | +18.50% |
| 6M Return ⓘ | +43.46% | +7.57% |
| Price vs. 200-Day MA ⓘ | +13.67% | +5.12% |
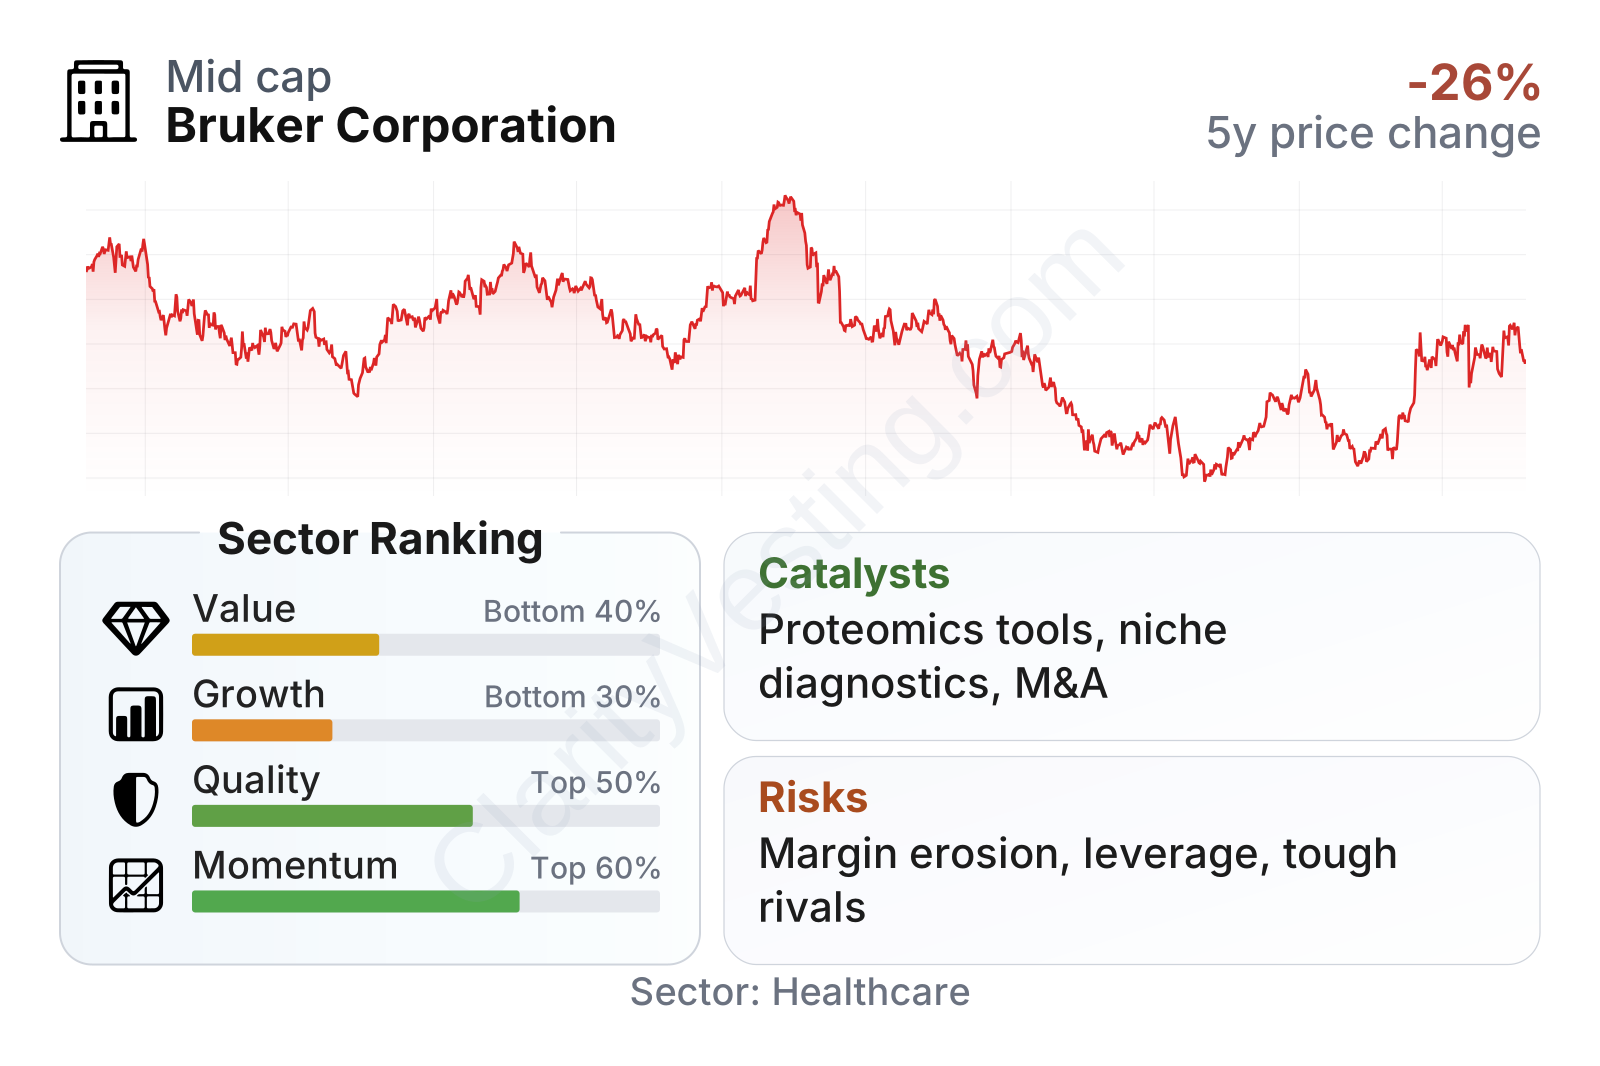
Bruker’s current profile is mixed. On one hand, the company remains sizable, has a reasonable five-year revenue-per-share growth record, and recent share price momentum has been much stronger than the broader healthcare sector. On the other hand, the latest snapshot shows weaker value and growth rankings versus peers, while profitability and cash generation have deteriorated from prior levels. The table also points to a business that historically produced better returns than it does today, which matters because the market is still assigning it a premium on several valuation measures.
Growth
Bruker operates in a sector with favorable long-term drivers. Research spending in life sciences, biopharma manufacturing, cell and gene therapy, proteomics, spatial biology, and advanced diagnostics all require more sophisticated analytical tools. The same applies to semiconductor, battery, and advanced materials research, where precise measurement and imaging are becoming more important. That gives Bruker exposure to structural growth areas rather than purely cyclical demand.
The company’s strategy also makes industrial sense. Bruker has been building around specialized instrument platforms that are difficult to replicate, then expanding through software, workflow tools, consumables, and targeted acquisitions. This is a common and often effective model in scientific instruments: once a laboratory adopts a platform, follow-on revenue can come from upgrades, support, and complementary tools.
Recent growth has clearly slowed from the stronger pace seen in 2023 and much of 2024. Year-over-year revenue growth moved from double-digit rates to roughly flat results in parts of 2025 before returning to low single digits in 2026. That rebound is encouraging, but it also suggests Bruker is no longer in a straightforward acceleration phase. At the moment, the business looks more like a company trying to regain operating rhythm than one delivering consistently strong expansion.
Cash generation deserves close attention. Free cash flow remained positive, but the recent trend is much softer than in earlier years, dropping materially by early 2026. That does not erase the company’s longer-term franchise value, but it does mean that current growth is not converting into cash as efficiently as it once did.
Several catalysts could still support future growth. Bruker has continued to focus on high-growth niches such as mass spectrometry, microbiology, proteomics, spatial biology, and applied diagnostics. These are areas where customers increasingly want higher sensitivity, faster throughput, and more integrated workflows. If recent acquisitions and product launches are integrated well, Bruker could strengthen its position in these faster-growing corners of the market.
Recent company updates have also highlighted ongoing portfolio shaping, including acquisitions intended to deepen capabilities in differentiated research and diagnostics tools. For a business like Bruker, that matters because carefully chosen bolt-on deals can expand the installed base, add recurring revenue, and improve cross-selling opportunities across laboratories already using the company’s instruments.
Risks
This article is for informational purposes only and does not constitute financial advice. Some content is AI-generated. See Disclaimer


