Stock Analysis · Berkshire Hathaway Inc (BRK-A)
Overview
Berkshire Hathaway is a large conglomerate built around insurance, investments, transportation, energy, manufacturing, retail, and service businesses. Its structure is unusual: some earnings come from wholly owned operating companies such as GEICO, BNSF Railway, Berkshire Hathaway Energy, Precision Castparts, Marmon, Lubrizol, and many consumer and industrial subsidiaries, while another important part comes from its portfolio of publicly traded stocks and cash equivalents. This mix gives Berkshire exposure to both the real economy and financial markets.
The company’s largest economic engine is insurance. Insurance subsidiaries collect premiums upfront, pay claims later, and generate investable funds known as “float.” Berkshire then deploys that float, along with retained earnings, into bonds, stocks, Treasury bills, and business acquisitions. That model has been central to the company for decades and helps explain why Berkshire does not look like a typical insurer, railroad, utility, or investment company alone.
Based on Berkshire’s latest annual reporting, revenue is spread across several major operating groups. Approximate shares of total revenue are as follows:
- Insurance and Other: about 34%. This includes insurance underwriting, insurance investment income, and a wide collection of non-insurance service and retail operations.
- BNSF Railway: about 24%. Freight rail transportation across North America, with exposure to consumer goods, industrial products, agricultural products, and energy-related shipments.
- Manufacturing: about 21%. A broad set of industrial, building, aerospace, chemical, and consumer product businesses.
- Berkshire Hathaway Energy: about 14%. Regulated electric and gas utilities, pipelines, renewable generation, and energy-related infrastructure.
- Service and Retailing: about 7%. Auto retail, vehicle services, furniture, apparel, and other consumer-facing activities.
Those percentages are approximate because Berkshire reports several large business groups separately and also includes investment-related income that can move from year to year. Even so, the broad picture is clear: Berkshire is diversified across essential sectors, with insurance at the center and transportation, energy, and industry providing additional scale.
The business flow over recent years shows revenue rising from roughly $276 billion in 2021 to about $371 billion in 2025, while operating income rebounded strongly after the 2022 downturn and remained near the upper end of the period in 2024 and 2025. Net income is far more volatile because accounting rules require Berkshire to include unrealized gains and losses from its stock portfolio, which can make bottom-line earnings swing sharply even when operating businesses remain stable.
Key Figures
| Metric | Value | Sector ⓘ |
|---|---|---|
| Date | Oct 31, 2026 | |
| Context | ||
| Sector | Financial Services | |
| Industry | Insurance - Diversified | |
| Market Cap ⓘ | $1.16T | |
| Beta ⓘ | 0.59 | |
Value (Cheapness) | ||
| P/E Ratio ⓘ | 13.61 | 12.20 |
| P/B Ratio ⓘ | 1.57 | 1.26 |
| FCF Yield ⓘ | 2.09% | 9.87% |
| Dividend Yield ⓘ | N/A | 2.87% |
| EBIT / EV ⓘ | 5.02% | 8.17% |
| PEG ⓘ | 9.68 | |
Growth (Business expansion) | ||
| Revenue Growth ⓘ | 10.00% | 8.40% |
| RPS Growth (5Y CAGR) ⓘ | 8.43% | 12.31% |
| EPS Growth (5Y CAGR) ⓘ | -5.93% | -4.03% |
| BVPS Growth (5Y CAGR) ⓘ | 9.76% | 4.96% |
| Margin Growth (5Y Trend) ⓘ | 45.71% | -4.14% |
| FCF Growth (5Y CAGR) ⓘ | -1.07% | 4.70% |
| DPS Growth (5Y CAGR) ⓘ | -8.15% | 8.85% |
Quality (Business durability) | ||
| ROIC (Latest) ⓘ | N/A | 9.35% |
| ROE (Latest) ⓘ | 11.84% | 13.95% |
| ROA (Latest) ⓘ | 6.89% | 1.57% |
| ROIC (5Y Median) ⓘ | 5.93% | 7.78% |
| ROE (5Y Median) ⓘ | 14.73% | 12.12% |
| ROA (5Y Median) ⓘ | 8.00% | 1.28% |
| Net Debt / EBIT (Latest) ⓘ | 1.42 | 0.99 |
| Net Debt / EBIT (5Y Median) ⓘ | 1.48 | 0.73 |
| Net Debt / EBITDA (Latest) ⓘ | 1.16 | 0.79 |
| Operating Margin (Latest) ⓘ | 16.25% | 22.61% |
| Operating Margin (5Y Median) ⓘ | 13.20% | 24.52% |
| Debt to Equity (Latest) ⓘ | 17.25% | 58.76% |
| Profit Margin (Latest) ⓘ | 22.30% | 26.18% |
| Free Cash Flow (Latest) ⓘ | $24.21B | |
Momentum (Price trend) | ||
| 3Y Return ⓘ | +59.34% | +95.34% |
| 12M Return (excl. last month) ⓘ | +0.54% | +16.22% |
| 6M Return ⓘ | +14.66% | +7.41% |
| Price vs. 200-Day MA ⓘ | +9.99% | +5.48% |
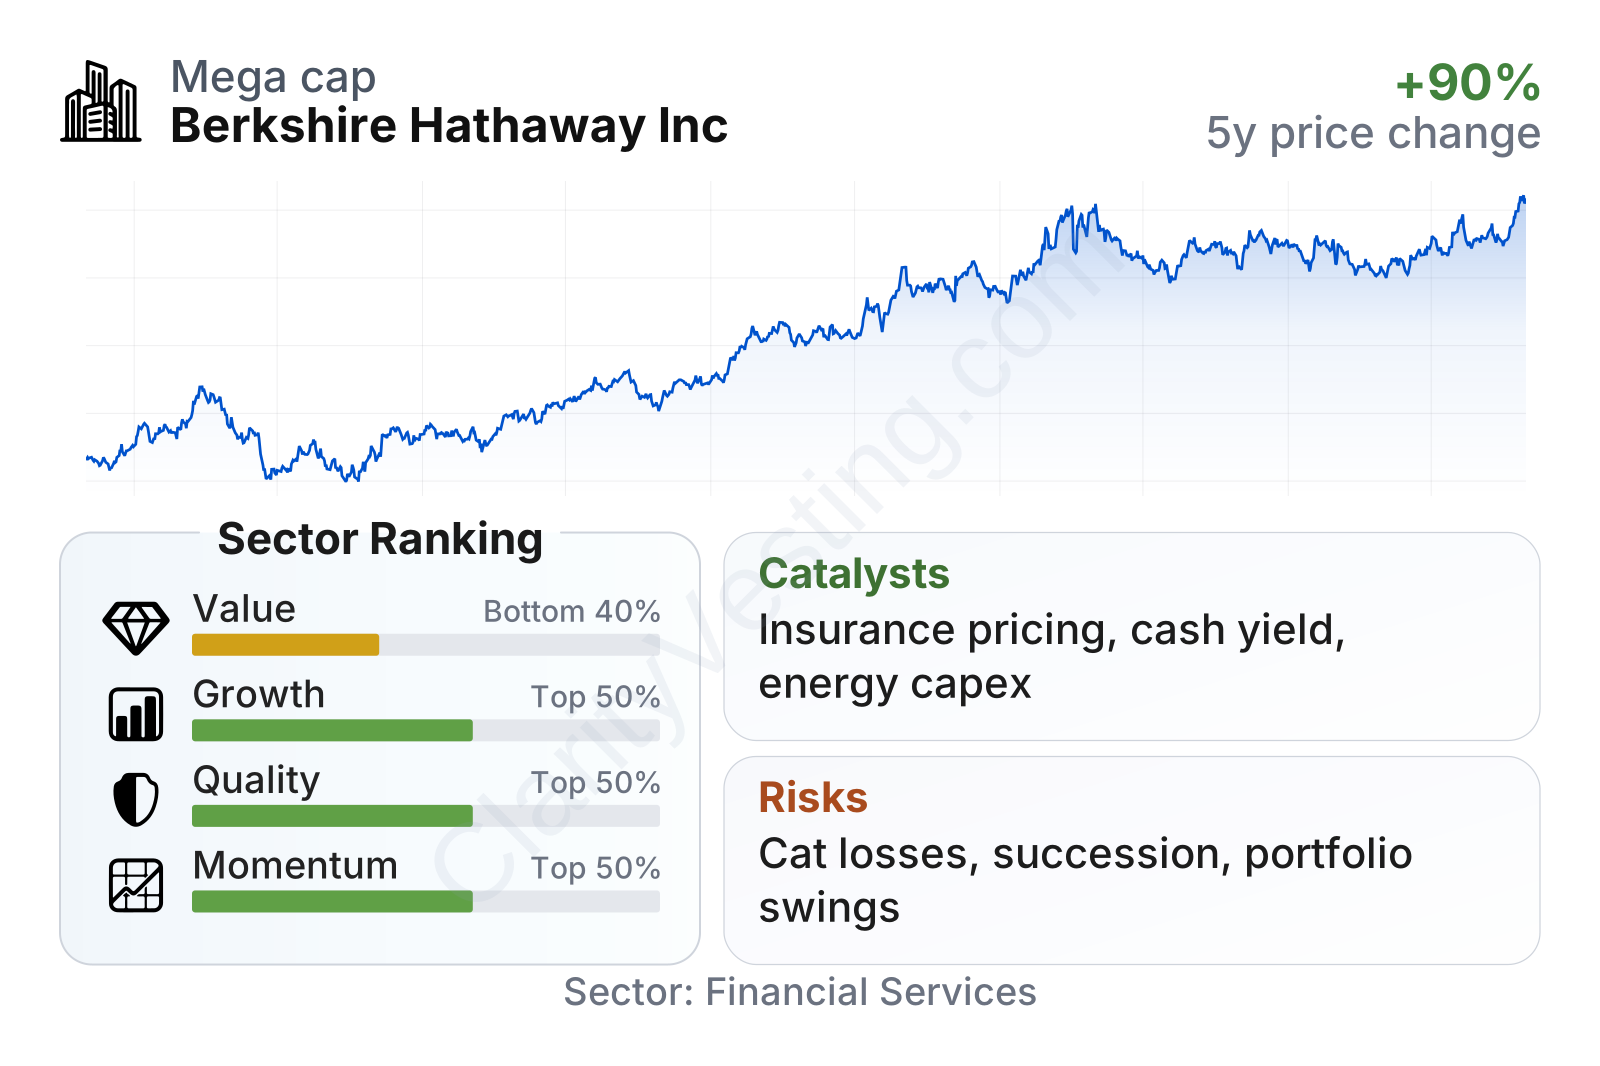
Berkshire stands out for its size, balance-sheet strength, and lower share-price volatility, with a beta around 0.60. On valuation metrics, it looks mixed rather than clearly cheap: its earnings multiple is close to the sector median, while its price-to-book ratio is modestly above the sector median. Quality is solid overall, helped by low debt relative to equity and unusually strong asset efficiency for such a large financial group. Growth indicators are respectable, especially in book value per share and margin improvement over time, while recent stock performance has trailed much of the broader financial sector.
Growth
Berkshire operates in sectors that are not all fast-growing, but many are durable and economically important: property and casualty insurance, freight rail, regulated utilities, industrial components, and essential consumer services. That matters for long-term growth because Berkshire does not rely on a single trend. It compounds through a combination of underwriting discipline, reinvestment of insurance float, expansion at subsidiaries, and selective capital allocation into acquisitions, share repurchases, and marketable securities.
Its strategy still makes sense for future growth. The insurance operation provides low-cost funding when underwriting is profitable, and Berkshire has historically been willing to keep a very large cash position until opportunities become attractive. That flexibility is a competitive strength in uncertain markets. Berkshire also benefits from owning businesses that can reinvest over long periods, especially in energy infrastructure and industrial operations, while BNSF remains tied to the flow of goods across the U.S. economy.
Recent earnings progression has been uneven on a headline basis because investment gains can distort results, but underlying operating performance has generally trended upward. Earnings per share rose strongly from 2021 through 2024 before easing in 2025, which fits Berkshire’s pattern of lumpier reported profit rather than a smooth linear path.
Book value per share has shown a clearer long-term climb, recovering from the 2022 decline and moving materially higher through 2025. For Berkshire, book value is not a perfect valuation tool, but it remains a useful way to track how much economic value has been built over time. The five-year growth rate in book value per share is notably above the sector median, which supports the case that the company has continued compounding capital at a healthy pace.
One major catalyst is insurance, especially where pricing remains firm after years of elevated catastrophe losses and inflation in claims costs. Another is the return on Berkshire’s very large liquidity reserves, since higher short-term interest rates can lift investment income on Treasury bills and cash-like holdings. In addition, Berkshire’s energy and utility operations continue to invest heavily in transmission, renewable assets, and grid infrastructure, areas supported by long-duration demand.
Recent company disclosures have also highlighted continued share repurchases at selected periods and ongoing capital discipline rather than aggressive deal-making. That may not create rapid expansion, but it reinforces Berkshire’s long-standing approach: protect capital, wait for favorable conditions, and let internally generated cash keep accumulating until opportunities emerge.
Risks
This article is for informational purposes only and does not constitute financial advice. Some content is AI-generated. See Disclaimer


