Stock Analysis · BP p.l.c (BPAQF)
Overview
BP p.l.c. is one of the world’s large integrated energy companies. In simple terms, it looks for and produces oil and natural gas, trades and transports those commodities, refines crude oil into fuels, sells gasoline and other products through service stations, and is also investing in lower-carbon businesses such as electric vehicle charging, bioenergy, and renewables. Its scale matters because the company operates across the full chain, from production in the ground to final sales to consumers and industrial customers.
BP’s revenue still comes overwhelmingly from traditional hydrocarbons and related trading activity. Based on its recent annual reporting structure, the main sources of revenue can be described approximately as follows:
- Customers & products: about 70% to 80% of revenue. This includes refined petroleum products, convenience retail, aviation fuel, lubricants, and related customer-facing activities.
- Gas & low carbon energy: about 15% to 25% of revenue. This includes natural gas, LNG, gas trading, power, and a growing set of lower-carbon and convenience-linked energy activities.
- Oil production & operations: about 5% to 10% of revenue. This includes upstream oil production and associated realized sales.
Those percentages are only broad approximations because BP reports performance through business segments that do not map perfectly into simple revenue buckets. What is clearer is that refining, marketing, and trading remain central, while gas and transition-related operations are becoming more important to the long-term mix.
BP’s recent financial profile also shows how sensitive the business is to commodity cycles. Revenue surged in 2022 when energy prices were unusually high, then came down as prices normalized. Over the last few years, operating profit has remained meaningful, but net income has been much more volatile, showing the impact of taxes, interest costs, and one-off items.
The long-term pattern points to a business with very large sales, thin end-profit margins, and meaningful swings between gross profit, operating income, and final earnings. That is typical for a major integrated oil company, but BP’s recent bottom-line volatility stands out even within that context.
Key Figures
| Metric | Value | Sector ⓘ |
|---|---|---|
| Date | Oct 03, 2026 | |
| Context | ||
| Sector | Energy | |
| Industry | Oil & Gas Integrated | |
| Market Cap ⓘ | $113.42B | |
| Beta ⓘ | -0.22 | |
Value (Cheapness) | ||
| P/E Ratio ⓘ | 20.97 | 14.47 |
| P/B Ratio ⓘ | 2.84 | 1.70 |
| FCF Yield ⓘ | 14.24% | 8.66% |
| Dividend Yield ⓘ | 4.58% | 3.77% |
| EBIT / EV ⓘ | 14.79% | 7.46% |
| PEG ⓘ | 0.06 | |
Growth (Business expansion) | ||
| Revenue Growth ⓘ | 48.20% | 27.35% |
| RPS Growth (5Y CAGR) ⓘ | 11.19% | 6.75% |
| EPS Growth (5Y CAGR) ⓘ | -26.32% | -15.45% |
| BVPS Growth (5Y CAGR) ⓘ | -14.21% | 5.85% |
| Margin Growth (5Y Trend) ⓘ | -2.79% | 0.75% |
| FCF Growth (5Y CAGR) ⓘ | -2.99% | 3.62% |
| DPS Growth (5Y CAGR) ⓘ | 10.60% | 16.85% |
Quality (Business durability) | ||
| ROIC (Latest) ⓘ | 10.43% | 11.33% |
| ROA (Latest) ⓘ | 1.88% | 6.03% |
| ROIC (5Y Median) ⓘ | 1.88% | 10.16% |
| ROA (5Y Median) ⓘ | 0.14% | 5.34% |
| Net Debt / EBIT (Latest) ⓘ | 1.60 | 1.62 |
| Net Debt / EBIT (5Y Median) ⓘ | 2.58 | 1.91 |
| Net Debt / EBITDA (Latest) ⓘ | 0.88 | 1.06 |
| Net Debt / Assets ⓘ | 12.06% | 17.29% |
| EBITDA / Interest ⓘ | 8.43 | 9.64 |
| Operating Margin (Latest) ⓘ | 10.29% | 16.32% |
| Operating Margin (5Y Median) ⓘ | 6.82% | 19.53% |
| Debt to Equity (Latest) ⓘ | 124.41% | 54.41% |
| Profit Margin (Latest) ⓘ | 2.55% | 8.79% |
| Free Cash Flow (Latest) ⓘ | $16.15B | |
Momentum (Price trend) | ||
| 3Y Return ⓘ | +33.03% | +62.93% |
| 12M Return (excl. last month) ⓘ | +19.92% | +44.83% |
| 6M Return ⓘ | -4.91% | -1.62% |
| Price vs. 200-Day MA ⓘ | +14.47% | +5.18% |
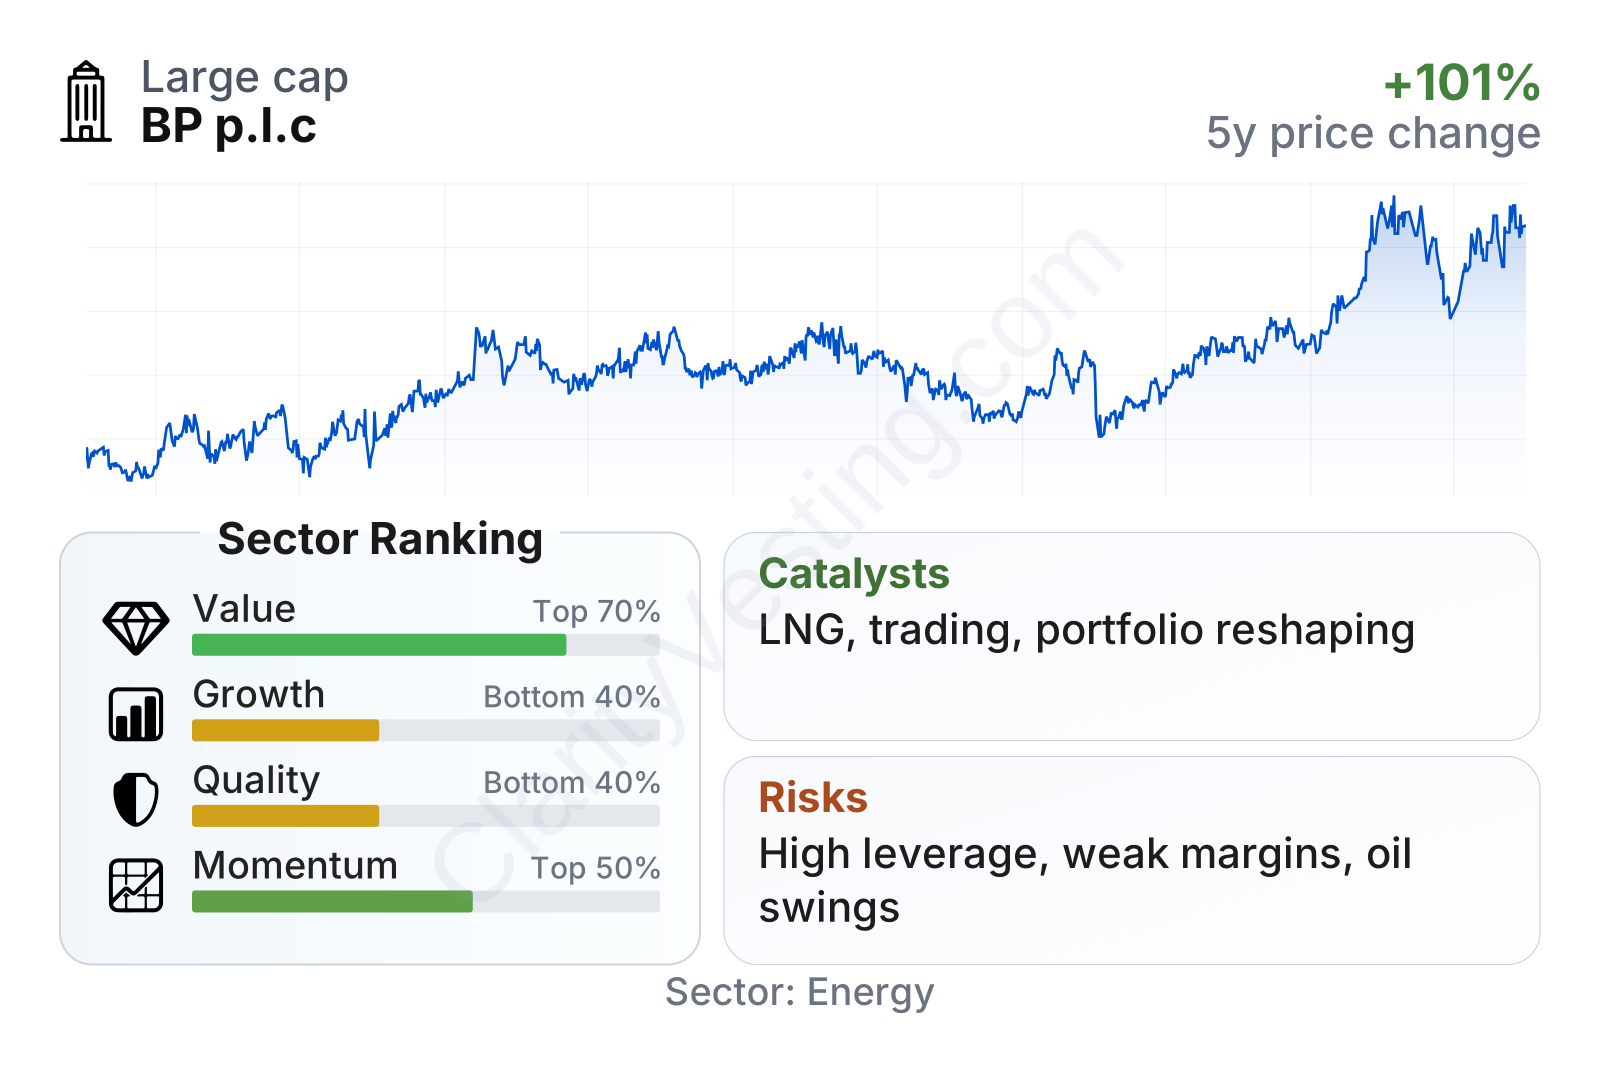
BP is a very large energy company, and the recent share-price trend has been strong over the past year even after some volatility. On valuation metrics, the picture is mixed: earnings and book multiples sit above sector medians, but cash-based measures are more favorable, with free cash flow yield, dividend yield, and EBIT relative to enterprise value all stronger than the typical peer. In other words, the market is not pricing BP like a deep discount stock, yet its cash generation still compares well within the sector.
The weaker part of the table is business quality and consistency. Profitability metrics, returns on assets, and long-term earnings trends rank below many peers, while leverage is noticeably higher than the sector median on a debt-to-equity basis. Growth also looks uneven: recent revenue growth has rebounded, but five-year earnings and book-value trends remain soft. Overall, the snapshot is that of a cash-generative but cyclical company whose financial strength depends heavily on execution and the commodity backdrop.
Growth
The broader energy sector is in a two-track phase. Oil and gas remain essential to the global economy, especially for transportation, chemicals, aviation, shipping, and power reliability in many regions. At the same time, long-term capital is moving toward lower-carbon energy, power trading, EV charging, biofuels, and LNG as a transition fuel. BP is positioned in both worlds, which gives it relevance, but also forces management to allocate capital carefully.
BP’s strategy broadly makes sense for future growth if it can balance near-term cash generation from oil and gas with disciplined expansion in transition-related businesses. LNG, gas marketing, trading, and convenience retail are attractive because they can offer steadier demand than upstream oil alone. The company’s customer-facing footprint also gives it a platform to add EV charging, convenience offerings, and energy services without building everything from scratch.
Recent sales growth has improved sharply after a period of contraction in 2023 and much of 2024. That rebound is encouraging, but it needs to be read carefully. For BP, revenue growth often reflects changes in commodity prices and trading conditions as much as pure volume expansion, so it does not automatically mean a structurally stronger business.
Free cash flow remains one of the most important indicators for BP’s long-term outlook. The company is still generating substantial cash in absolute terms, even though it is below the stronger period seen earlier in the cycle. That cash matters because it supports dividends, buybacks, debt management, and investment in future projects. A key catalyst is BP’s ability to keep free cash flow resilient while shifting part of the portfolio toward gas, power, and lower-carbon operations.
Recent company updates have also highlighted ongoing portfolio reshaping through asset sales, project development, and selective investment in higher-return areas. For a business like BP, these moves can unlock value if they simplify the portfolio, improve returns, and reduce the drag from lower-performing assets. The strongest opportunity is not a single breakthrough event, but a combination of disciplined hydrocarbon production, LNG and trading strength, and measured growth in customer and transition businesses.
Risks
This article is for informational purposes only and does not constitute financial advice. Some content is AI-generated. See Disclaimer