Stock Analysis · BP PLC (BP)
Overview
BP p.l.c. is one of the world’s large integrated energy companies. In simple terms, it operates across the full oil and gas chain: it explores for hydrocarbons, produces crude oil and natural gas, trades and transports energy, refines crude into fuels, and sells gasoline, diesel, jet fuel, lubricants, and related products to businesses and consumers. It also has a growing presence in lower-carbon activities such as bioenergy, electric vehicle charging, convenience retail linked to fuel stations, and renewable power development.
BP reports its business through a mix of production, customer-facing, and transition-focused activities. Based on recent annual reporting, the largest economic drivers still come from oil and gas production, refining and fuel marketing, and trading. Exact revenue by business line is not always the best way to understand BP because trading and refining can create very large reported sales with thinner margins, while upstream production may generate a larger share of profit than its share of revenue suggests. Using the company’s segment disclosures and the structure of the business, the revenue base can be understood approximately as follows:
- Customers & products: about 60% to 70% — refining, fuel supply, service stations, convenience retail, aviation fuel, Castrol lubricants, and other marketed products.
- Gas & low carbon energy: about 15% to 25% — natural gas production, LNG, gas trading, and selected lower-carbon energy activities.
- Oil production & operations: about 10% to 20% — crude oil production and related upstream activities.
- Other businesses: low single-digit share — including legacy items, corporate activities, and smaller transition businesses.
That mix shows why BP is not only a bet on oil prices. A meaningful part of the group depends on refining margins, fuel demand, global gas markets, and trading performance. At the same time, hydrocarbons still dominate the business model and cash generation.
Over the last several years, the company’s overall sales base has remained very large, but profit conversion has been far more volatile. Revenue surged in 2022 when energy prices spiked, then cooled as markets normalized. Operating income remained positive, but net income became much thinner in 2024 and 2025, showing how sensitive BP remains to commodity prices, refining conditions, and one-off charges.
The broad trend is clear: BP continues to generate enormous sales, but only a relatively small portion reaches the bottom line when market conditions weaken. Cost of revenue stays extremely high, and interest expense has also moved up over time, which matters when profits are under pressure.
Key Figures
| Metric | Value | Sector ⓘ |
|---|---|---|
| Date | Oct 24, 2026 | |
| Context | ||
| Sector | Energy | |
| Industry | Oil & Gas Integrated | |
| Market Cap ⓘ | $127.21B | |
| Beta ⓘ | -0.20 | |
Value (Cheapness) | ||
| P/E Ratio ⓘ | 24.09 | 15.40 |
| P/B Ratio ⓘ | 3.22 | 1.71 |
| FCF Yield ⓘ | 12.69% | 8.24% |
| Dividend Yield ⓘ | 4.08% | 3.52% |
| EBIT / EV ⓘ | 14.52% | 7.45% |
| PEG ⓘ | 0.06 | |
Growth (Business expansion) | ||
| Revenue Growth ⓘ | 48.20% | 26.85% |
| RPS Growth (5Y CAGR) ⓘ | 11.19% | 6.78% |
| EPS Growth (5Y CAGR) ⓘ | -21.83% | -14.41% |
| BVPS Growth (5Y CAGR) ⓘ | -14.21% | 6.08% |
| Margin Growth (5Y Trend) ⓘ | -4.43% | 0.55% |
| FCF Growth (5Y CAGR) ⓘ | -2.99% | 2.75% |
| DPS Growth (5Y CAGR) ⓘ | 10.60% | 16.79% |
Quality (Business durability) | ||
| ROIC (Latest) ⓘ | 10.22% | 11.30% |
| ROA (Latest) ⓘ | 1.91% | 6.00% |
| ROIC (5Y Median) ⓘ | 1.88% | 10.35% |
| ROA (5Y Median) ⓘ | 0.14% | 5.46% |
| Net Debt / EBIT (Latest) ⓘ | 1.63 | 1.64 |
| Net Debt / EBIT (5Y Median) ⓘ | 2.47 | 1.82 |
| Net Debt / EBITDA (Latest) ⓘ | 0.89 | 1.08 |
| Net Debt / Assets ⓘ | 12.06% | 17.29% |
| EBITDA / Interest ⓘ | 8.14 | 9.53 |
| Operating Margin (Latest) ⓘ | 10.00% | 16.21% |
| Operating Margin (5Y Median) ⓘ | 7.47% | 20.55% |
| Debt to Equity (Latest) ⓘ | 124.41% | 52.27% |
| Profit Margin (Latest) ⓘ | 2.55% | 8.79% |
| Free Cash Flow (Latest) ⓘ | $16.14B | |
Momentum (Price trend) | ||
| 3Y Return ⓘ | +47.89% | +68.93% |
| 12M Return (excl. last month) ⓘ | +33.01% | +42.90% |
| 6M Return ⓘ | +11.17% | +9.18% |
| Price vs. 200-Day MA ⓘ | +19.27% | +9.87% |
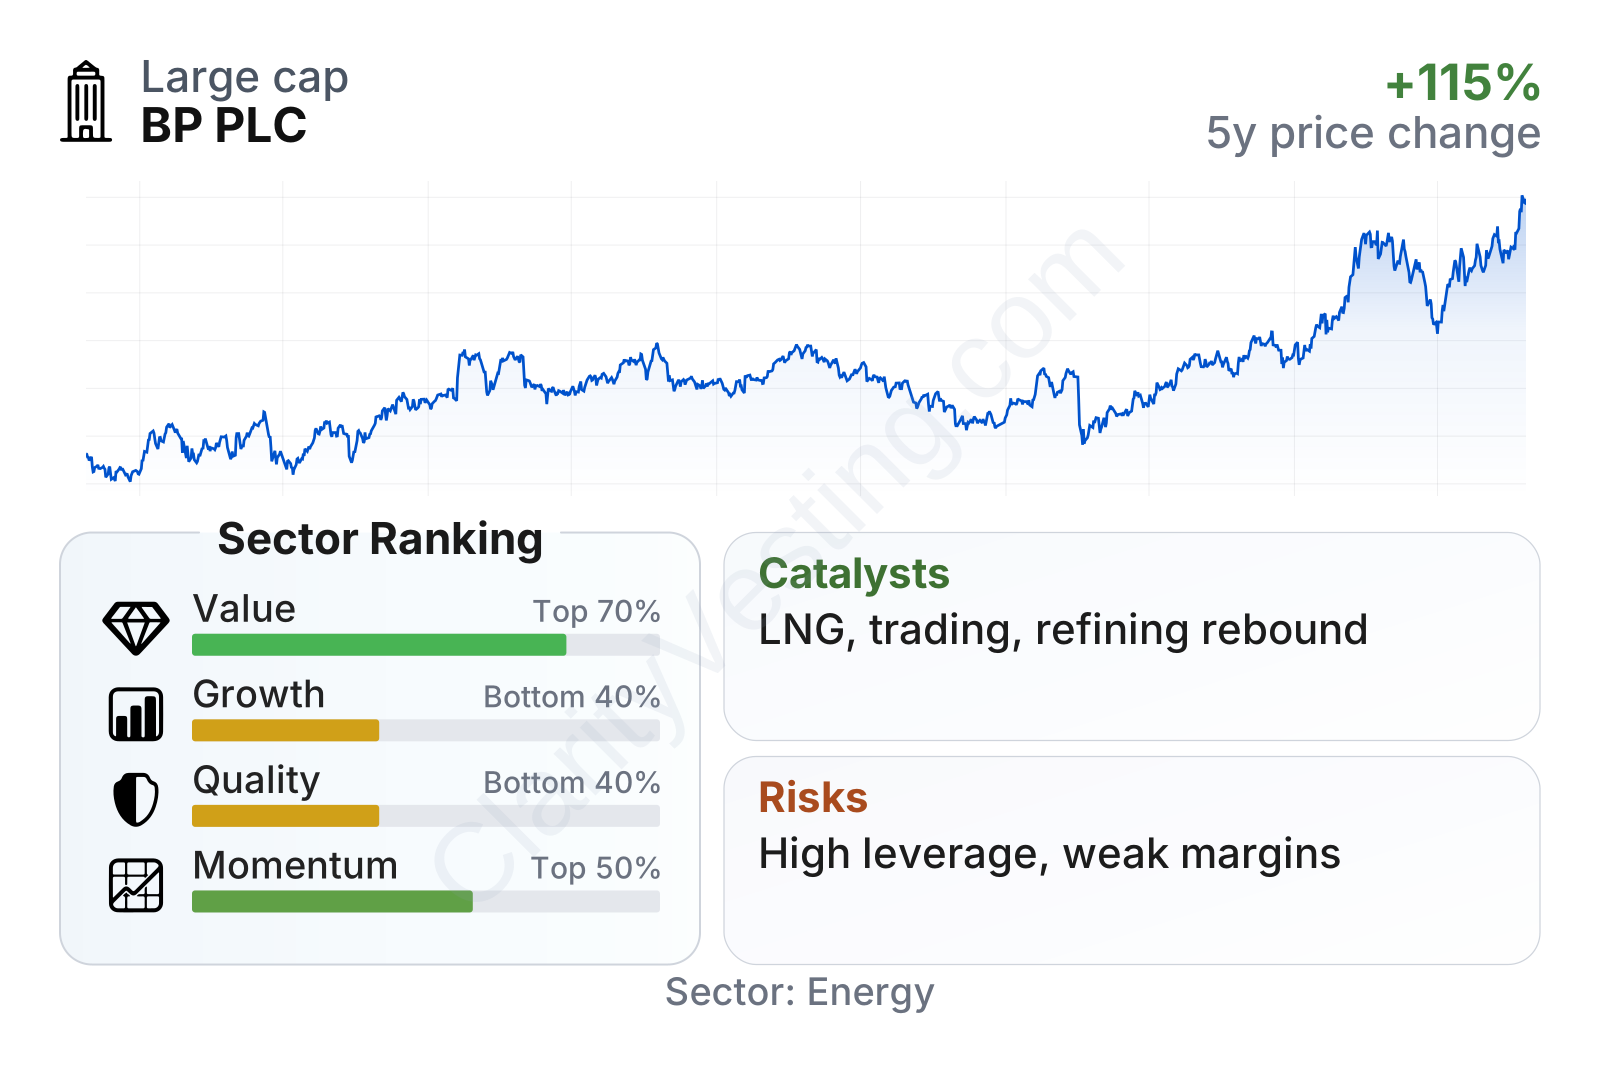
BP remains a very large energy company, but the current profile is mixed. On valuation measures tied to cash generation, it stands out positively: free cash flow yield, dividend yield, and EBIT relative to enterprise value are all stronger than the sector median. By contrast, traditional headline multiples such as price-to-earnings and price-to-book are not especially low versus peers. Quality and growth measures look weaker, with profitability below sector norms and momentum trailing many energy stocks despite a strong rebound over the longer part of the period shown.
The stock history also illustrates BP’s cyclical nature. Shares climbed strongly from 2021 into 2024, then became more volatile. That pattern fits a business whose earnings depend heavily on energy markets rather than steady, predictable expansion.
Growth
BP operates in a sector that is mature in its traditional form but still important globally. Oil and gas demand remains structurally large, especially for transport, petrochemicals, aviation, and industry. At the same time, the sector is gradually reshaping itself around LNG, power, biofuels, convenience retail, and electric mobility. That gives BP two different growth paths: improving returns from its existing hydrocarbon system, and selectively building positions in energy transition businesses.
Its strategy broadly makes industrial sense if judged through a long-term lens. BP has scale in global trading, a large customer network, and integrated operations that can move molecules and products from production to end market. Those are useful advantages in a world where energy systems are becoming more complex rather than simpler. LNG and gas trading are especially relevant because natural gas is often treated as a bridge fuel in many countries, and BP already has a meaningful footprint there.
Recent growth has improved after a weaker stretch. Revenue growth turned negative through much of 2023 and 2024 as energy prices normalized, then recovered meaningfully into 2026. That rebound suggests BP still has strong operating leverage when industry conditions become more favorable, but it also confirms that growth is cyclical rather than consistently compounding.
Free cash flow remains one of the more important positives. It is below the peak reached earlier in the cycle, but it is still substantial in absolute terms, running in the low tens of billions of dollars on a trailing basis. For a capital-intensive company, that matters because free cash flow supports debt service, capital spending, dividends, and share repurchases while giving management room to adjust through commodity cycles.
Potential catalysts for future expansion include stronger oil and gas pricing, improved refining margins, continued strength in trading, and execution in convenience, EV charging, and bioenergy. BP has also continued reshaping its portfolio through asset sales, project startups, and selective investment into businesses intended to produce steadier customer-linked earnings over time. In the near term, any improvement in global LNG balances or higher realized upstream prices could have an outsized effect on results because the company’s earnings base has already been compressed from prior highs.
Risks
This article is for informational purposes only and does not constitute financial advice. Some content is AI-generated. See Disclaimer


