Stock Analysis · Bank of Hawaii Corporation (BOH)
Overview
Bank of Hawaii Corporation is a regional bank headquartered in Honolulu. It operates mainly in Hawaii, with additional presence in Guam and other Pacific Islands. Its business is relatively straightforward: it gathers deposits from households and businesses, makes loans, provides payment and cash-management services, and earns fees from wealth management, card services, and other banking activities. For long-term analysis, the key point is that this is a geographically focused bank with a strong local franchise rather than a fast-expanding national lender.
Like most banks, Bank of Hawaii makes most of its money from the spread between what it earns on loans and securities and what it pays on deposits and other funding. Based on recent annual reporting, revenue can be approximated as follows:
- Net interest income: about 75% to 80% of total revenue. This is the core banking engine and includes interest earned on commercial loans, residential mortgages, consumer loans, leases, and the securities portfolio, minus interest paid on deposits and borrowings.
- Trust and asset management, service charges, card income, and other fee income: about 20% to 25% of total revenue. This includes deposit account fees, debit and credit card-related income, treasury management, wealth and trust services, and other customer service fees.
The business mix is important because it shows both strength and limitation. A high share of net interest income means earnings can recover when deposit costs stabilize and lending spreads improve, but it also means results remain sensitive to interest-rate shifts. The bank’s footprint in Hawaii gives it a durable local position, especially in consumer and commercial banking, yet it also ties performance to the economic health of a single state and tourism-linked activity.
The longer financial pattern shows revenue rising from roughly $690 million in 2021 to more than $1.0 billion in 2025, while profit did not follow the same path because interest expense climbed sharply during the higher-rate period. That is a useful snapshot of the current setup: business volume and revenue improved, but funding costs absorbed a meaningful part of that benefit.
The revenue base has expanded over the past several years, but the flow to net income became less efficient in 2023 and 2024 as deposit and funding costs surged. The improvement in 2025 suggests some stabilization, though profitability has not fully returned to earlier levels.
Key Figures
| Metric | Value | Sector ⓘ |
|---|---|---|
| Date | Oct 17, 2026 | |
| Context | ||
| Sector | Financial Services | |
| Industry | Banks - Regional | |
| Market Cap ⓘ | $2.60B | |
| Beta ⓘ | 0.71 | |
Value (Cheapness) | ||
| P/E Ratio ⓘ | 12.25 | 12.26 |
| P/B Ratio ⓘ | 1.43 | 1.23 |
| FCF Yield ⓘ | 10.20% | 10.40% |
| Dividend Yield ⓘ | 4.23% | 3.02% |
| EBIT / EV ⓘ | 9.67% | 8.14% |
| PEG ⓘ | 2.10 | |
Growth (Business expansion) | ||
| Revenue Growth ⓘ | 12.90% | 9.35% |
| RPS Growth (5Y CAGR) ⓘ | 11.43% | 12.19% |
| EPS Growth (5Y CAGR) ⓘ | -18.16% | -9.53% |
| BVPS Growth (5Y CAGR) ⓘ | 6.67% | 4.99% |
| Margin Growth (5Y Trend) ⓘ | -22.54% | -3.86% |
| FCF Growth (5Y CAGR) ⓘ | -15.11% | 4.81% |
| DPS Growth (5Y CAGR) ⓘ | 4.25% | 8.79% |
Quality (Business durability) | ||
| ROIC (Latest) ⓘ | 11.57% | 9.49% |
| ROE (Latest) ⓘ | 12.27% | 13.90% |
| ROA (Latest) ⓘ | 0.98% | 1.55% |
| ROIC (5Y Median) ⓘ | 10.48% | 7.86% |
| ROE (5Y Median) ⓘ | 11.96% | 12.17% |
| ROA (5Y Median) ⓘ | 0.86% | 1.30% |
| Net Debt / EBIT (Latest) ⓘ | -1.19 | 0.96 |
| Net Debt / EBIT (5Y Median) ⓘ | -0.08 | 0.73 |
| Net Debt / EBITDA (Latest) ⓘ | -1.08 | 0.92 |
| Operating Margin (Latest) ⓘ | 28.07% | 22.30% |
| Operating Margin (5Y Median) ⓘ | 24.68% | 24.63% |
| Debt to Equity (Latest) ⓘ | 4.99% | 58.56% |
| Profit Margin (Latest) ⓘ | 31.35% | 26.57% |
| Free Cash Flow (Latest) ⓘ | $264.79M | |
Momentum (Price trend) | ||
| 3Y Return ⓘ | +53.32% | +88.33% |
| 12M Return (excl. last month) ⓘ | +17.58% | +19.38% |
| 6M Return ⓘ | -13.02% | +4.75% |
| Price vs. 200-Day MA ⓘ | -10.85% | +3.50% |
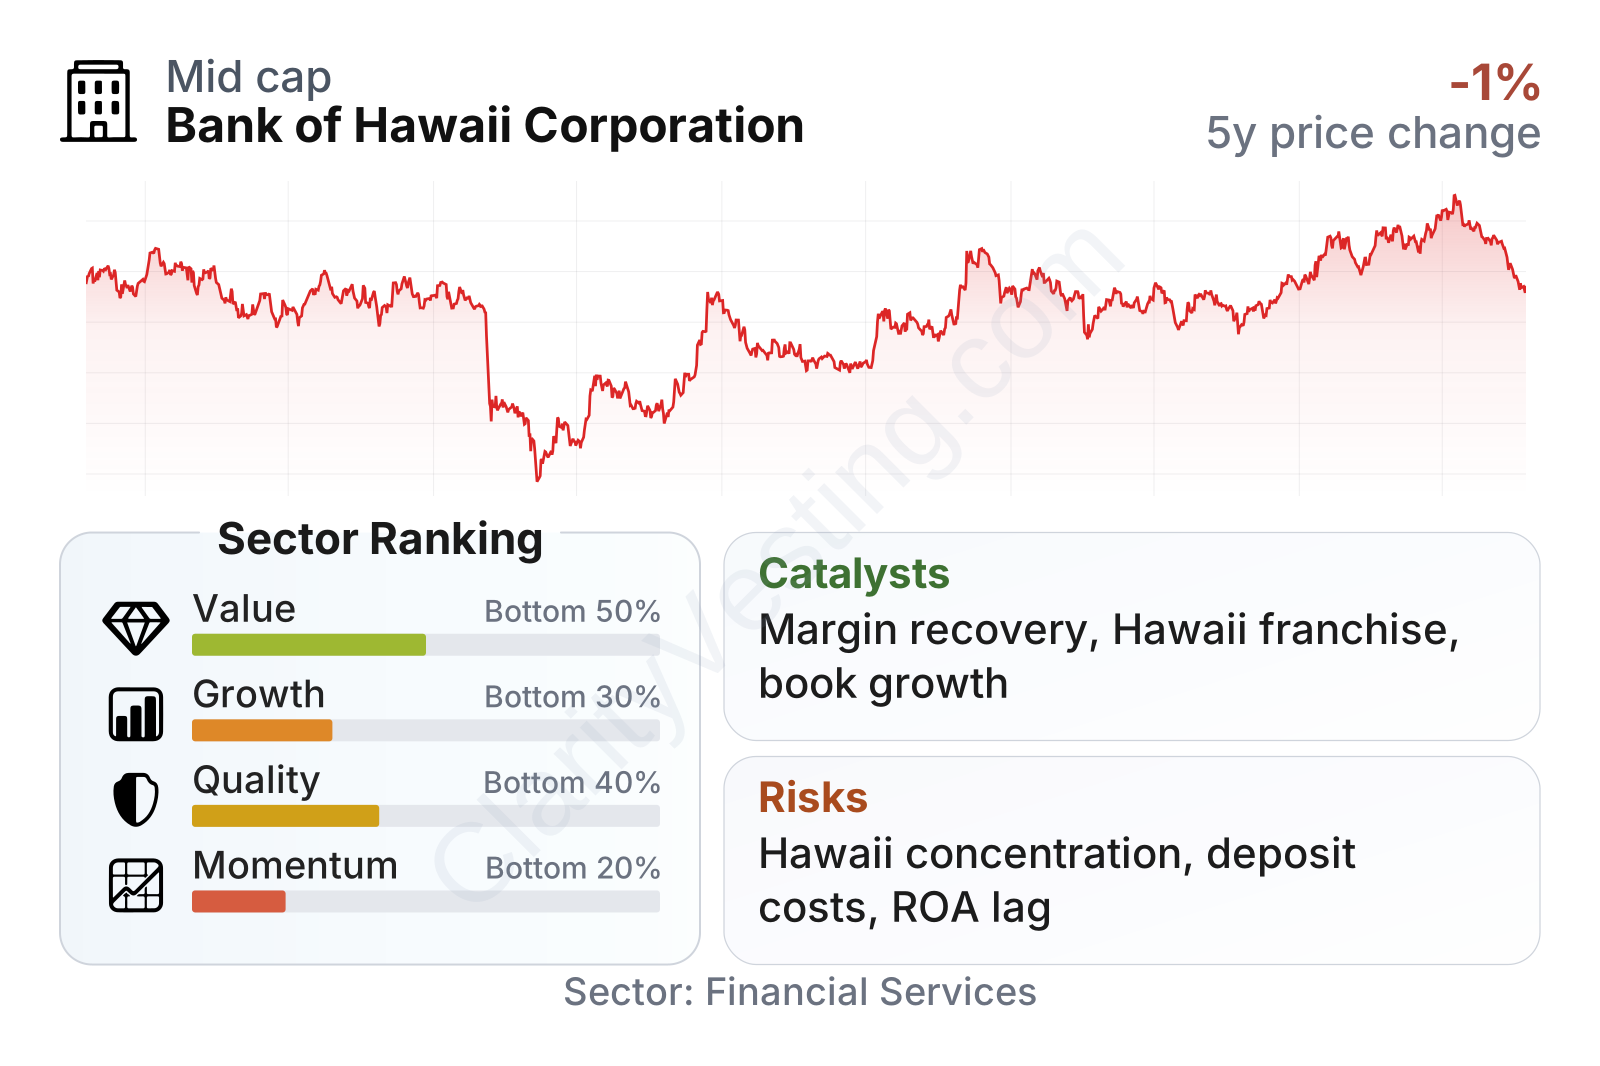
Bank of Hawaii is a mid-sized regional bank with a relatively low share-price volatility profile, as shown by its beta below 1. On valuation, it sits near the sector on earnings but somewhat above the sector on price-to-book, which suggests the market still assigns value to its franchise quality and local deposit base. The company’s quality and growth rankings are weaker than the sector median, largely because profitability metrics and earnings growth have been pressured in recent years, while momentum has also lagged after a softer six-month period.
The share-price history also reflects the broader regional-bank stress cycle. The stock dropped sharply in 2023, then recovered meaningfully through 2024 to 2026. That rebound indicates confidence has improved, but it also means the market has already recognized part of the normalization case.
Growth
Banking is not a high-growth industry in the same way as software or semiconductors, but it remains essential and can grow steadily alongside population, household wealth, business formation, and credit demand. In Bank of Hawaii’s case, the relevant question is less about explosive expansion and more about whether the bank can deepen relationships in a stable, defended market while restoring profitability after the deposit-cost shock that affected many regional banks.
Its strategy is sensible for that kind of environment. The bank emphasizes long-standing customer relationships, core deposits, commercial and consumer lending, and fee-based businesses such as trust and asset management. That matters because fee income can make earnings more resilient, while a strong local deposit franchise can become a competitive advantage when funding is expensive across the industry.
A major long-term support factor is the nature of Hawaii itself. The state’s banking market has high barriers to entry, limited large-scale local competition, and customer relationships that tend to be more durable than in many mainland markets. If tourism activity, real estate values, employment, and local business activity remain healthy, that creates a constructive backdrop for loan demand, payments activity, and wealth balances.
Earnings per share show the challenge clearly: profits fell materially from 2021 through 2024, then improved in 2025. That pattern suggests the bank is in a recovery phase rather than a clean multi-year earnings uptrend. For long-term assessment, the important question is whether the 2025 rebound becomes a sustained normalization rather than a one-year bounce.
Book value per share has moved upward over the last several years, especially after 2023. That is an encouraging sign for a bank because book value is a core measure of balance-sheet strength. Even though earnings were pressured, the company still compounded book value at a respectable pace over five years, better than many might expect from looking only at recent profit weakness.
Recent company reporting and investor communications have also pointed to ongoing focus on balance-sheet repositioning, deposit pricing discipline, and expense control. Those are not dramatic growth catalysts, but for a regional bank they are meaningful. If interest-rate pressure eases further and deposit costs stop rising, the earnings impact can be significant because the bank does not need very rapid loan growth to improve returns.
Risks
This article is for informational purposes only and does not constitute financial advice. Some content is AI-generated. See Disclaimer


