Stock Analysis · Brookfield Wealth Solutions Ltd (BNT)
Overview
Brookfield Wealth Solutions Ltd is a financial services company focused on retirement services, annuities, life insurance, and capital solutions. In simple terms, it manages long-duration insurance and retirement liabilities and invests the associated assets with the goal of earning attractive returns over long periods. The company is part of the wider Brookfield ecosystem, which matters because Brookfield has a large global platform in credit, infrastructure, real estate, and private investments that can help source assets and investment opportunities.
Its business model is typical of many insurance and retirement-focused groups: it collects premiums or assumes blocks of insurance liabilities, invests those funds, earns spread income between investment returns and policy obligations, and may also generate fee-like income from structuring and servicing transactions. Reported results can look more volatile than those of a traditional asset manager because insurance accounting, investment marks, and transaction timing can move earnings around from period to period.
Based on company disclosures, the main economic drivers are broadly the following:
- Net investment income and spread-based earnings – the largest contributor. This comes from investing policyholder assets and corporate capital across fixed income, credit, and other long-duration assets.
- Annuities and retirement services – a major operating source tied to pension risk transfer, annuity issuance, and reinsurance arrangements that bring in premiums and investable assets.
- Life insurance and reinsurance activities – income from underwriting, policy servicing, and managing acquired or reinsured insurance blocks.
- Other investment and mark-to-market items – a smaller but sometimes meaningful contributor that can create swings in reported revenue and profit from year to year.
Public filings do not always present a simple consumer-style revenue split with stable percentages because insurance groups often report through premiums, net investment income, policy benefits, and fair-value-related items rather than clean product sales categories. What is clear is that investment income and retirement-related insurance liabilities are at the center of the business.
The recent revenue path shows how quickly the company has scaled. Revenue rose sharply from roughly $1 billion in 2021 to more than $14 billion in 2024, before easing in 2025, while net income remained positive but more uneven. That pattern is consistent with a business that is growing through transactions and capital deployment rather than through a slow, linear sales model.
The flow of revenue and expenses highlights a business that expanded rapidly through 2024, with profit also rising, but 2025 brought a less favorable mix: revenue stayed large, yet net income stepped down. For a long-term reader, that suggests scale has improved faster than consistency.
Key Figures
| Metric | Value | Sector ⓘ |
|---|---|---|
| Date | Oct 03, 2026 | |
| Context | ||
| Sector | Financial Services | |
| Industry | Insurance - Diversified | |
| Market Cap ⓘ | $10.02B | |
| Beta ⓘ | 1.63 | |
Value (Cheapness) | ||
| P/E Ratio ⓘ | 43.48 | 12.60 |
| P/B Ratio ⓘ | 0.76 | 1.23 |
| FCF Yield ⓘ | 32.46% | 10.16% |
| Dividend Yield ⓘ | 0.71% | 2.96% |
| EBIT / EV ⓘ | 5.95% | 7.77% |
| PEG ⓘ | N/A | |
Growth (Business expansion) | ||
| Revenue Growth ⓘ | 38.90% | 9.50% |
| RPS Growth (5Y CAGR) ⓘ | 6.67% | 12.10% |
| EPS Growth (5Y CAGR) ⓘ | -67.93% | -9.45% |
| BVPS Growth (5Y CAGR) ⓘ | 7.91% | 5.01% |
| Margin Growth (5Y Trend) ⓘ | -2.99% | -4.07% |
| FCF Growth (5Y CAGR) ⓘ | 10.83% | 4.96% |
| DPS Growth (5Y CAGR) ⓘ | -61.03% | 8.79% |
Quality (Business durability) | ||
| ROIC (Latest) ⓘ | 2.63% | 9.60% |
| ROE (Latest) ⓘ | 0.79% | 13.84% |
| ROA (Latest) ⓘ | 0.07% | 1.53% |
| ROIC (5Y Median) ⓘ | N/A | 7.86% |
| ROE (5Y Median) ⓘ | 12.18% | 12.20% |
| ROA (5Y Median) ⓘ | 1.20% | 1.29% |
| Net Debt / EBIT (Latest) ⓘ | -4.77 | 0.91 |
| Net Debt / EBIT (5Y Median) ⓘ | -2.71 | 0.74 |
| Net Debt / EBITDA (Latest) ⓘ | -3.93 | 0.97 |
| Operating Margin (Latest) ⓘ | 6.29% | 22.12% |
| Operating Margin (5Y Median) ⓘ | 13.06% | 24.39% |
| Debt to Equity (Latest) ⓘ | 54.98% | 60.37% |
| Profit Margin (Latest) ⓘ | 1.06% | 26.62% |
| Free Cash Flow (Latest) ⓘ | $3.25B | |
Momentum (Price trend) | ||
| 3Y Return ⓘ | +83.98% | +89.23% |
| 12M Return (excl. last month) ⓘ | -9.10% | +17.35% |
| 6M Return ⓘ | -12.76% | +10.00% |
| Price vs. 200-Day MA ⓘ | -16.81% | +3.73% |
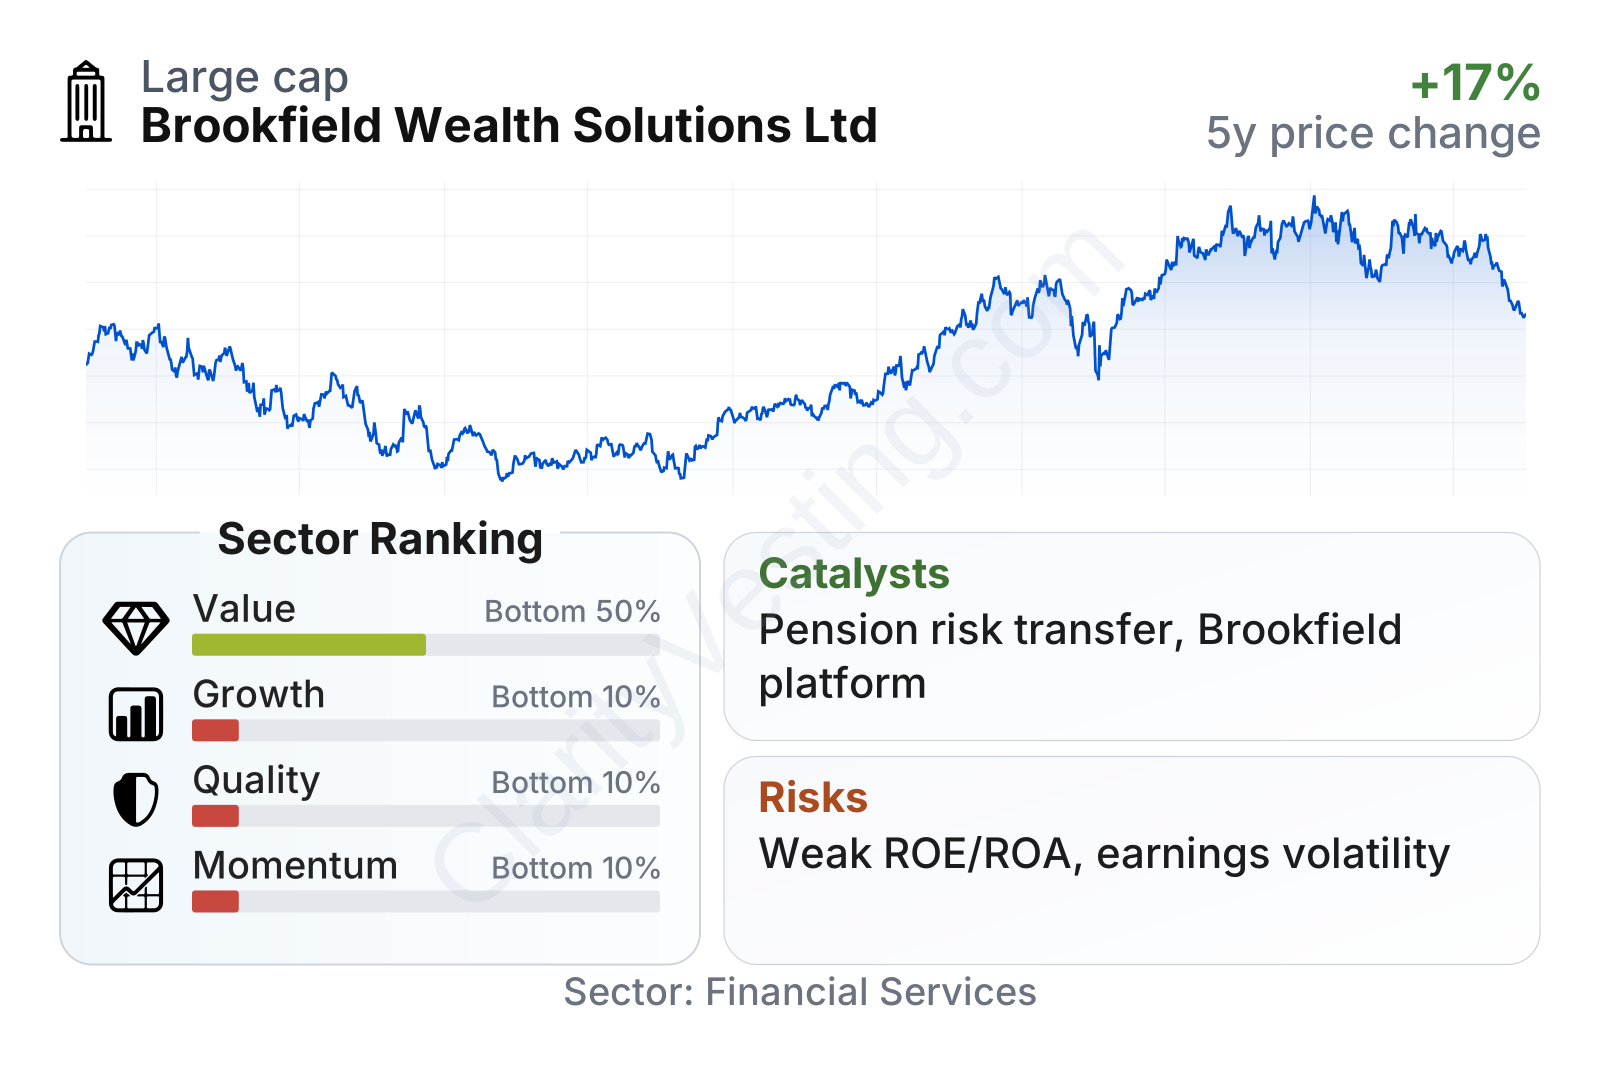
Brookfield Wealth Solutions is a mid-sized listed financial company with a market value around $10 billion, so it is large enough to access capital markets but still much smaller than the biggest global insurers. The stock has been volatile, with a beta above 1.6, and the price history reflects that: after a deep decline in 2022, the shares recovered strongly into 2025 and then moved more sideways in 2026.
The mixed profile in the metrics table is important. On one side, revenue growth has been strong, free cash flow generation looks robust, and leverage appears manageable, with net cash rather than heavy net debt on these measures. On the other side, profitability ratios are weak versus the sector, especially recent return on equity, return on assets, and operating margin. The market is therefore looking at a company with clear scale-building momentum, but still waiting for cleaner proof that growth is turning into strong, repeatable shareholder returns.
Growth
Brookfield Wealth Solutions operates in a part of financial services that has attractive long-term structural support. Aging populations, the need for retirement income products, pension de-risking by corporations, and demand from insurers for reinsurance and capital solutions all create a large opportunity set. In plain language, more institutions and individuals need help managing long-term savings and guaranteed income obligations, and that should keep demand for retirement and insurance balance-sheet capacity elevated.
The company’s strategy is logically aligned with that backdrop. It is building scale in annuities, pension risk transfer, and insurance-related asset origination while relying on Brookfield’s investment platform to seek higher-yielding long-duration assets. If executed well, that combination can be powerful: more liabilities create more investable assets, and better asset sourcing can widen spreads over time.
Earnings per share show why the market’s view remains unsettled. The company moved from a loss in 2021 to profitability, but EPS has not followed a smooth upward path and has weakened again more recently. That does not invalidate the expansion strategy, but it does show that growth in scale has not yet translated into stable per-share earnings.
Book value per share has also been uneven, though still above earlier starting levels over the multiyear period. For an insurer, book value matters because it is a rough indicator of the capital base supporting future business. The trend suggests progress, but not the kind of steady compounding that usually makes valuation easier to judge.
A major catalyst is the company’s access to Brookfield’s broader origination and institutional network. In insurance, sourcing assets at attractive spreads is a core competitive advantage. Another catalyst is continued expansion in pension risk transfer and reinsurance transactions, where large pools of liabilities can move to specialized operators. If Brookfield Wealth Solutions keeps adding liabilities while preserving underwriting discipline and investment quality, earnings capacity could rise meaningfully from today’s base.
Recent company communications have also emphasized growth through strategic transactions and institutional partnerships. That is significant because this business does not rely only on retail product sales; it can grow by taking on blocks of assets and liabilities in large deals, which can accelerate scale much faster than organic growth alone.
Risks
This article is for informational purposes only and does not constitute financial advice. Some content is AI-generated. See Disclaimer


