Stock Analysis · Broadstone Net Lease Inc (BNL)
Overview
Broadstone Net Lease Inc. is a real estate investment trust, or REIT. In simple terms, it owns properties and collects rent from tenants. Its focus is on single-tenant net lease real estate, a structure where the tenant usually pays not only rent, but also many property-level costs such as taxes, insurance, and maintenance. That can make cash flow more predictable than in some other types of real estate.
The company owns a diversified portfolio across industrial, retail, restaurant, and other property types, and it also has exposure to healthcare facilities. Its strategy is built around long lease terms, broad tenant diversification, and properties that are generally important to the tenant’s operations. That matters for long-term shareholders because REIT performance often depends on rent stability, occupancy, lease duration, and access to capital.
Broadstone’s revenue mainly comes from rental income generated by its owned properties. Based on recent company disclosures, the portfolio is tilted toward industrial real estate, with meaningful contributions from retail and smaller contributions from restaurants, healthcare, and other categories.
- Industrial properties: approximately 50% to 60% of annual base rent. This usually includes logistics, manufacturing, warehouse, and distribution facilities.
- Retail properties: approximately 15% to 25% of annual base rent. These are generally freestanding stores and service-oriented locations.
- Restaurants: approximately 10% to 15% of annual base rent. This includes quick-service and casual dining locations under long leases.
- Healthcare: approximately 5% to 10% of annual base rent. This can include medical and clinical real estate leased to operators.
- Other property types: the remaining share, generally a small portion of rent, including office-related or specialty assets where applicable.
From a cash-flow perspective, the business has been fairly steady over the last several years. Revenue moved from roughly the low-$380 million range in 2021 to about the high-$450 million range in 2025, but profits were less smooth because interest expense rose sharply in 2025. Operating profitability remained strong, which shows the basic property portfolio is still producing solid rent spreads even as financing costs became more of a drag.
Key Figures
| Metric | Value | Sector ⓘ |
|---|---|---|
| Date | Oct 17, 2026 | |
| Context | ||
| Sector | Real Estate | |
| Industry | REIT - Diversified | |
| Market Cap ⓘ | $3.83B | |
| Beta ⓘ | 0.94 | |
Value (Cheapness) | ||
| P/E Ratio ⓘ | 24.00 | 17.38 |
| P/B Ratio ⓘ | 1.32 | 0.85 |
| FCF Yield ⓘ | 7.05% | 7.38% |
| Dividend Yield ⓘ | 6.36% | 4.85% |
| EBIT / EV ⓘ | 4.06% | 3.78% |
| PEG ⓘ | N/A | |
Growth (Business expansion) | ||
| Revenue Growth ⓘ | 8.30% | 5.30% |
| RPS Growth (5Y CAGR) ⓘ | -0.14% | 6.02% |
| EPS Growth (5Y CAGR) ⓘ | -3.26% | -11.37% |
| BVPS Growth (5Y CAGR) ⓘ | -2.81% | 0.45% |
| Margin Growth (5Y Trend) ⓘ | 3.42% | -0.22% |
| FCF Growth (5Y CAGR) ⓘ | 2.61% | 5.40% |
| DPS Growth (5Y CAGR) ⓘ | 4.13% | 5.02% |
Quality (Business durability) | ||
| ROIC (Latest) ⓘ | 4.66% | 5.69% |
| ROE (Latest) ⓘ | 5.27% | 7.56% |
| ROA (Latest) ⓘ | 2.54% | 2.85% |
| ROIC (5Y Median) ⓘ | 4.20% | 4.22% |
| ROE (5Y Median) ⓘ | 4.44% | 6.03% |
| ROA (5Y Median) ⓘ | 2.31% | 2.44% |
| Net Debt / EBIT (Latest) ⓘ | 10.63 | 7.59 |
| Net Debt / EBIT (5Y Median) ⓘ | 10.04 | 8.40 |
| Net Debt / EBITDA (Latest) ⓘ | 6.41 | 5.27 |
| Net Debt / Assets ⓘ | 46.27% | 37.76% |
| EBITDA / Interest ⓘ | 4.06 | 4.10 |
| Operating Margin (Latest) ⓘ | 53.39% | 35.29% |
| Operating Margin (5Y Median) ⓘ | 48.73% | 37.31% |
| Debt to Equity (Latest) ⓘ | 94.59% | 88.87% |
| Profit Margin (Latest) ⓘ | 30.61% | 19.61% |
| Free Cash Flow (Latest) ⓘ | $270.27M | |
Momentum (Price trend) | ||
| 3Y Return ⓘ | +51.99% | +30.75% |
| 12M Return (excl. last month) ⓘ | +14.33% | +4.36% |
| 6M Return ⓘ | -7.17% | -2.52% |
| Price vs. 200-Day MA ⓘ | -6.17% | -2.34% |
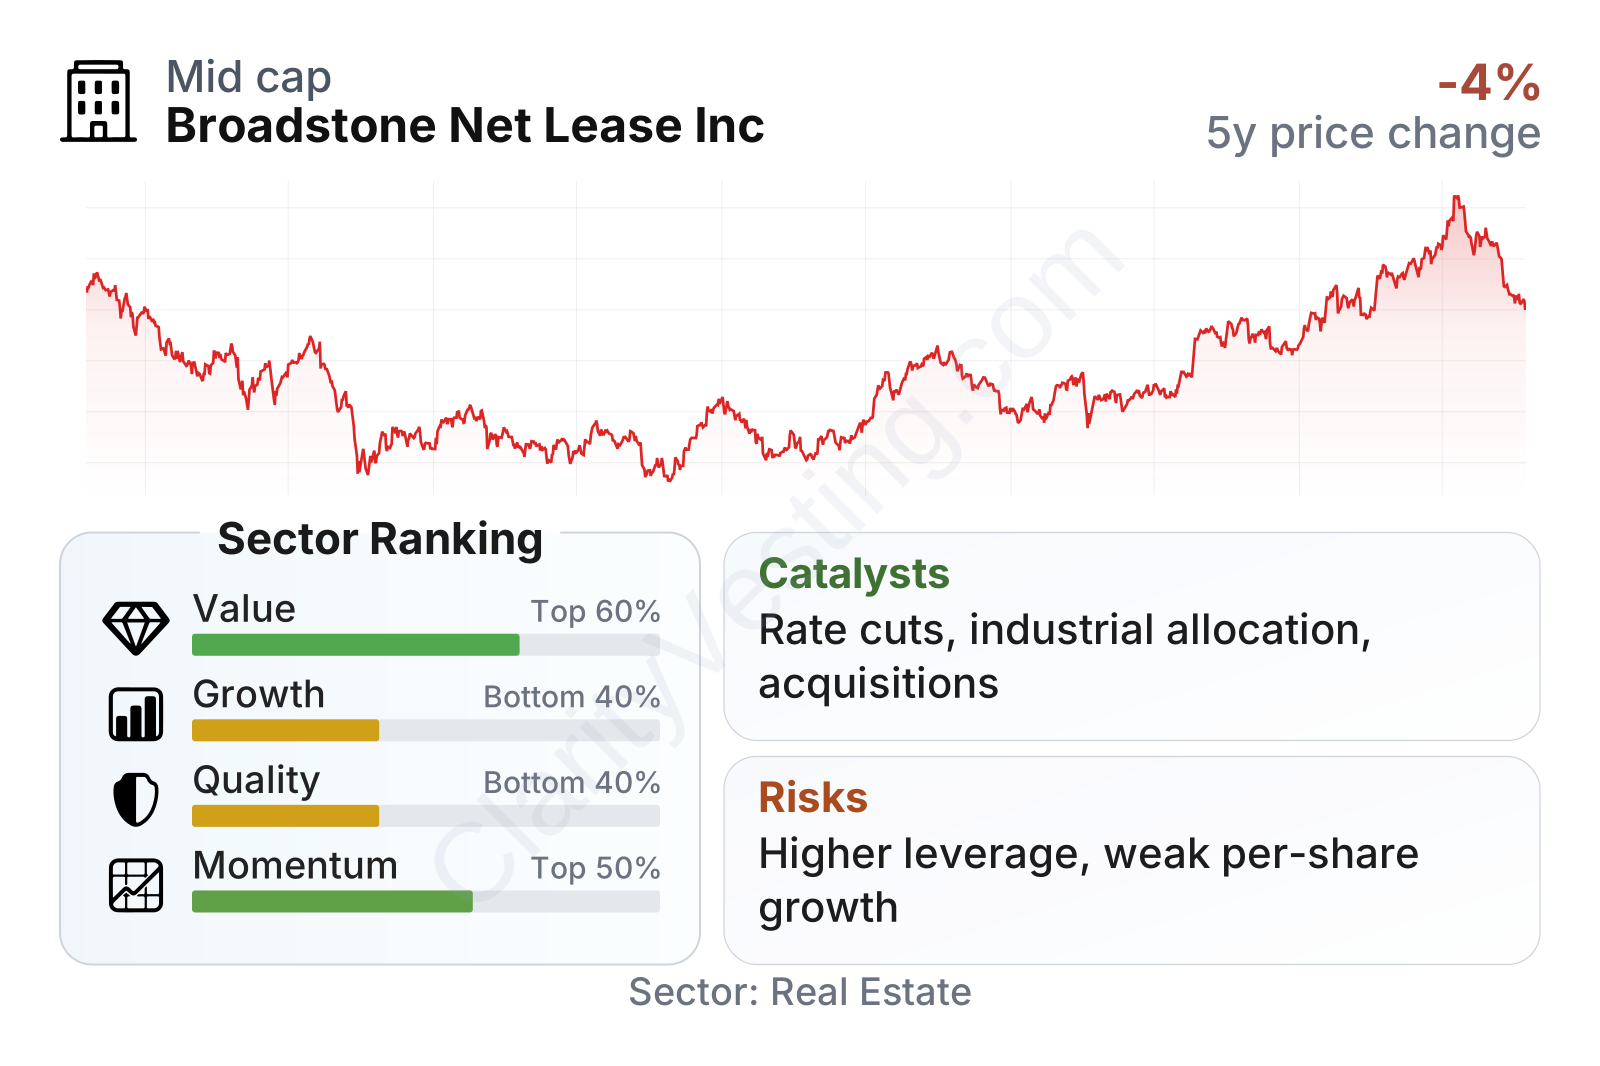
Broadstone is a mid-sized REIT with a market value around $4 billion and a stock volatility close to the broader market. The table points to a mixed profile. On valuation, the shares trade above the sector median on both earnings and book value measures, although the dividend yield remains higher than the sector median at a little above 6%. On quality, operating margin and profit margin are strong, but leverage is heavier than the sector norm. On growth, recent year-over-year revenue growth has been decent, yet the longer five-year trend in revenue per share and book value per share has been weak. On momentum, the stock has outperformed much of the real estate sector over the last one and three years, although it has recently been trading slightly below its 200-day average.
Growth
Broadstone operates in a part of the real estate market that still has long-term relevance. Net lease properties appeal to tenants because they provide operational control and often lower landlord involvement, while landlords value predictable rent streams. Industrial real estate remains one of the most durable segments because it benefits from supply-chain infrastructure, e-commerce distribution, and domestic manufacturing activity. That helps Broadstone because industrial assets make up the largest piece of its portfolio.
The company’s strategy also makes sense in the current environment. Broad diversification reduces dependence on any one tenant or property type, and long lease terms help smooth results over time. Broadstone has also been shifting capital toward industrial assets and away from categories with weaker long-term outlooks. That kind of portfolio recycling can improve resilience even if it does not produce fast headline growth.
Growth, however, needs to be viewed carefully. Total revenue has trended upward over time, but revenue per share has been mostly flat over the last five years, staying around the low-$2 per share range. That means acquisitions and rent growth have not translated into strong per-share expansion. For a REIT, that is an important distinction because long-term shareholders ultimately benefit more from growth on a per-share basis than from simple portfolio size expansion.
The dividend record is steadier than the revenue-per-share record. Dividend per share has increased from about $0.94 in 2021 to a little over $1.10 in 2025. The pace has slowed recently, but the pattern still suggests a business designed around durable cash distribution rather than rapid expansion. A meaningful catalyst for future growth would be a lower interest-rate backdrop, because that can improve property values, reduce financing pressure, and make acquisitions more attractive for net lease REITs. Another catalyst is continued deployment into industrial and necessity-based real estate where tenant demand tends to be more durable.
Recent company updates have also highlighted ongoing investment activity, portfolio management, and capital allocation discipline rather than a single transformational event. That is typical for this kind of REIT: the opportunity usually comes from many smaller leasing, acquisition, and financing decisions rather than one large breakthrough.
Risks
This article is for informational purposes only and does not constitute financial advice. Some content is AI-generated. See Disclaimer


