Stock Analysis · Brookfield Corp (BN)
Overview
Brookfield Corp is a global alternative asset manager and capital allocator. In simple terms, it raises money from institutions and wealthy clients, invests that money in long-life assets and operating businesses, and also invests its own capital alongside those clients. Its areas of focus include renewable power, infrastructure, private equity, real estate, insurance solutions, and credit. The company sits at the center of the broader Brookfield group and benefits from management fees, performance-based earnings, distributions from invested capital, and returns from businesses it owns.
That structure makes Brookfield different from a traditional bank or a plain investment fund. Part of the business earns recurring fee income from managing outside capital, while another part is tied to the performance and value of assets the company owns directly. This combination can create meaningful upside when asset values rise and when Brookfield launches new funds, but it also makes reported results more complex and sometimes more volatile than those of a simpler asset manager.
Based on Brookfield’s recent company disclosures, its economic engine is mainly built around fee-bearing capital, carried interest and incentive income, insurance-related earnings, and returns from invested capital. Exact percentages can shift materially from year to year because realizations, asset sales, and market movements affect results. At a high level, the main sources of revenue and earnings can be understood as follows:
- Asset management fees and related earnings: recurring fees earned for managing private funds and listed strategies across infrastructure, renewable power, private equity, real estate, and credit.
- Performance revenues: carried interest and incentive distributions earned when investment performance clears required thresholds.
- Insurance solutions and credit: spread-related earnings and fees tied to insurance assets and credit platforms.
- Returns on Brookfield’s invested capital: dividends, distributions, monetizations, and valuation gains from principal investments in the Brookfield ecosystem.
- Operating revenues from consolidated businesses: revenue from businesses Brookfield controls and consolidates, which can be very large in accounting terms but do not fully represent fee earnings available to shareholders.
The long-term appeal of the model is scale. Brookfield manages a very large pool of capital across real assets and private markets, sectors where clients often commit money for many years. That can support sticky fee income and repeated fundraising cycles, especially when institutions want exposure to infrastructure, energy transition, private credit, and other alternatives.
The business mix also helps explain why revenue can look uneven while operating income remains sizable. Over the last several years, total revenue moved up and down, but gross profit improved and operating income stayed strong. At the same time, interest expense climbed sharply, which reduced how much of that operating profit ultimately reached net income.
Key Figures
| Metric | Value | Sector ⓘ |
|---|---|---|
| Date | Oct 03, 2026 | |
| Context | ||
| Sector | Financial Services | |
| Industry | Asset Management | |
| Market Cap ⓘ | $81.39B | |
| Beta ⓘ | 1.82 | |
Value (Cheapness) | ||
| P/E Ratio ⓘ | 67.52 | 12.60 |
| P/B Ratio ⓘ | 1.87 | 1.23 |
| FCF Yield ⓘ | -11.42% | 10.16% |
| Dividend Yield ⓘ | 0.71% | 2.96% |
| EBIT / EV ⓘ | 6.87% | 7.77% |
| PEG ⓘ | 1.27 | |
Growth (Business expansion) | ||
| Revenue Growth ⓘ | 8.50% | 9.50% |
| RPS Growth (5Y CAGR) ⓘ | -9.39% | 12.10% |
| EPS Growth (5Y CAGR) ⓘ | -3.73% | -9.45% |
| BVPS Growth (5Y CAGR) ⓘ | -30.17% | 5.01% |
| Margin Growth (5Y Trend) ⓘ | -0.05% | -4.07% |
| FCF Growth (5Y CAGR) ⓘ | N/A | 4.96% |
| DPS Growth (5Y CAGR) ⓘ | -24.53% | 8.79% |
Quality (Business durability) | ||
| ROIC (Latest) ⓘ | 5.10% | 9.60% |
| ROE (Latest) ⓘ | 2.86% | 13.84% |
| ROA (Latest) ⓘ | 0.27% | 1.53% |
| ROIC (5Y Median) ⓘ | 5.73% | 7.86% |
| ROE (5Y Median) ⓘ | 1.38% | 12.20% |
| ROA (5Y Median) ⓘ | 0.26% | 1.29% |
| Net Debt / EBIT (Latest) ⓘ | 10.97 | 0.91 |
| Net Debt / EBIT (5Y Median) ⓘ | 11.30 | 0.74 |
| Net Debt / EBITDA (Latest) ⓘ | 7.48 | 0.97 |
| Operating Margin (Latest) ⓘ | 29.31% | 22.12% |
| Operating Margin (5Y Median) ⓘ | 22.61% | 24.39% |
| Debt to Equity (Latest) ⓘ | 568.98% | 60.37% |
| Profit Margin (Latest) ⓘ | 1.77% | 26.62% |
| Free Cash Flow (Latest) ⓘ | -$9.29B | |
Momentum (Price trend) | ||
| 3Y Return ⓘ | +85.53% | +89.23% |
| 12M Return (excl. last month) ⓘ | -8.75% | +17.35% |
| 6M Return ⓘ | -10.01% | +10.00% |
| Price vs. 200-Day MA ⓘ | -15.77% | +3.73% |
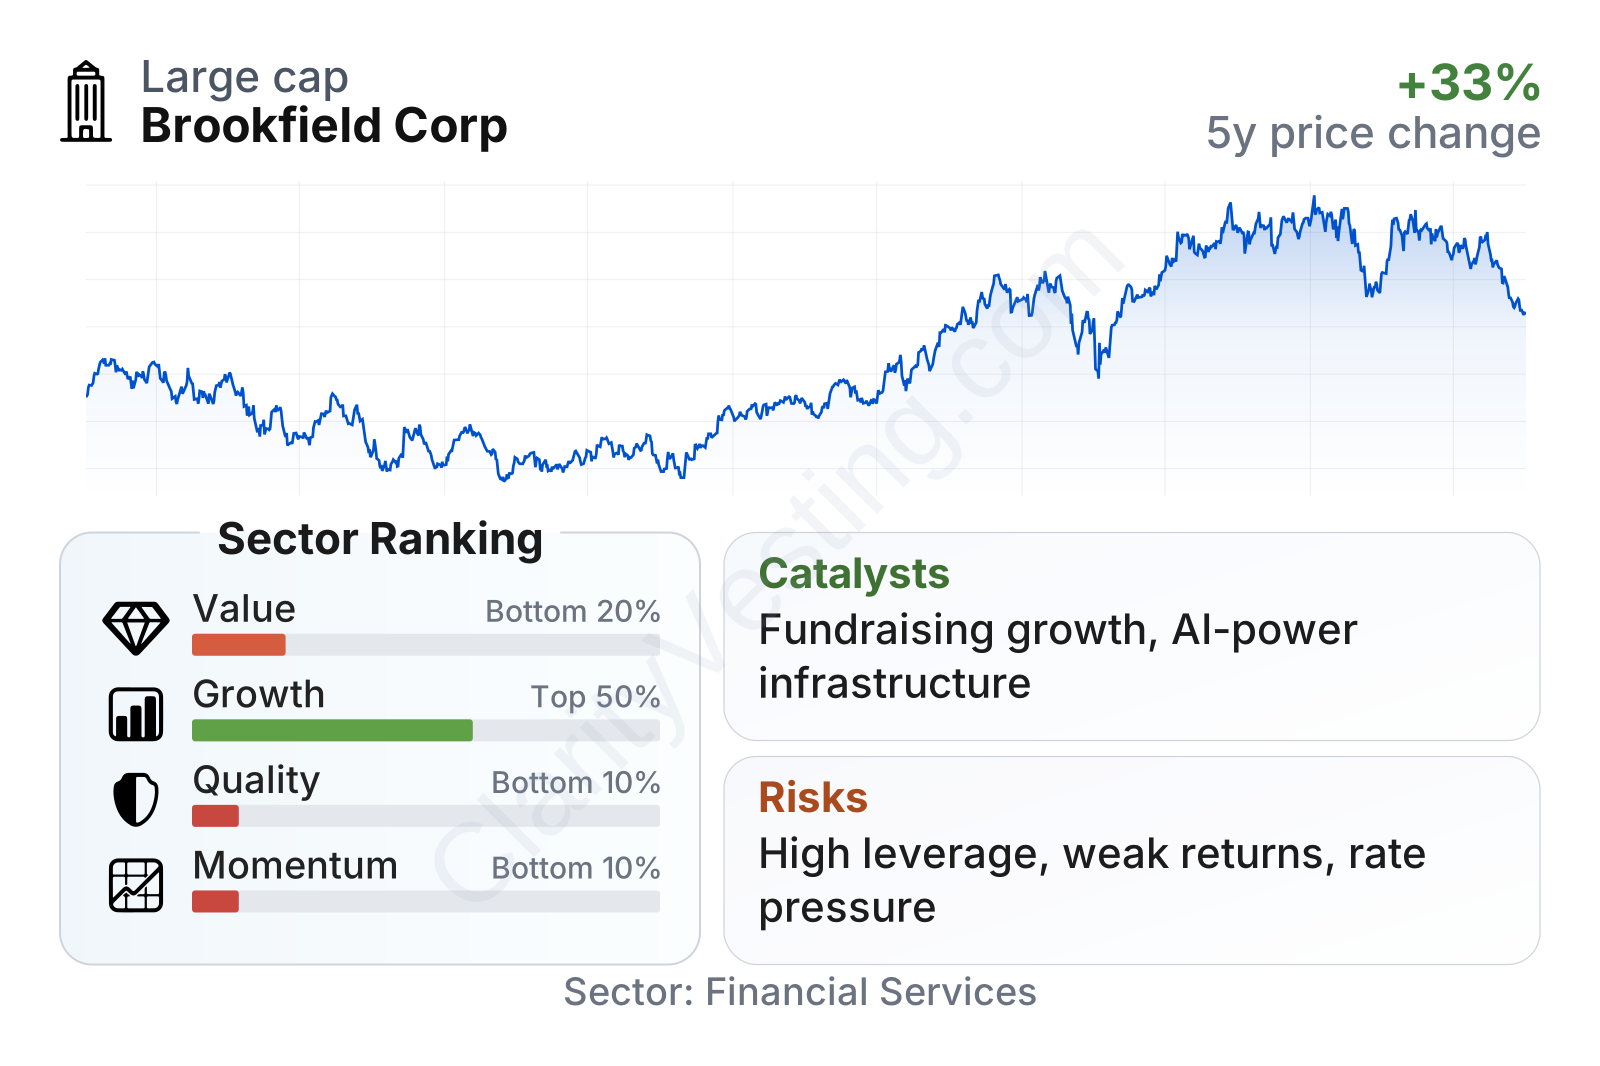
Brookfield is a very large company in asset management, but the current metric profile is mixed. On growth, it sits around the middle of the sector, supported by positive recent revenue expansion and better long-term earnings resilience than some peers. On quality, however, returns on equity and assets remain well below sector norms, while leverage is much higher than typical financial firms. On value, the stock screens as expensive relative to the sector on earnings and somewhat expensive on book value, while the dividend yield is low and free cash flow is currently negative. Recent price performance has also lagged the sector, showing that the market has become more selective despite the company’s scale.
Growth
Brookfield operates in parts of finance that still have long runway for expansion. Alternative asset management has benefited from institutions shifting money away from traditional stocks and bonds toward infrastructure, private credit, renewable power, data infrastructure, and other real assets. These areas are attractive because they often offer long-duration cash flows, inflation linkage, and limited supply. Brookfield is already deeply positioned in those categories, which gives it exposure to some of the strongest structural themes in global capital markets.
The company’s strategy also makes sense for future growth. Brookfield has built specialized platforms rather than relying on a single business line. It can raise funds, acquire assets during market dislocations, improve operations, refinance assets when conditions allow, and then recycle capital into new opportunities. That approach is particularly relevant today because many asset owners need fresh capital for power infrastructure, digital infrastructure, and private credit, while some competitors face tighter financing conditions.
Another important catalyst is insurance and credit. Brookfield has been building these areas as they can generate recurring fee streams and create demand for long-duration assets. This broadens the firm beyond traditional private equity-style realizations and can smooth results over time. The continued institutional appetite for private credit and asset-backed strategies could therefore become one of the most important drivers of fee-bearing capital growth.
Recent company updates have also pointed to continued fundraising activity, asset recycling, and deployment into sectors linked to artificial intelligence infrastructure, electricity demand growth, and energy transition spending. Those are especially important because data centers, transmission networks, renewable generation, and related infrastructure require enormous capital over many years. Brookfield’s global sourcing network and operating experience make it one of the more credible participants in that buildout.
Earnings per share have improved from the depressed 2022 level and remain above where they stood several years ago, even if the path has not been smooth. That pattern fits Brookfield’s model: results can advance meaningfully over time, but they often move unevenly because asset sales, market values, and financing costs do not occur in a straight line.
Book value per share looks disrupted by the post-separation reporting base, so the trend should be read carefully rather than taken as a clean long-term decline. More recently, book value per share has been edging upward again, which suggests underlying capital value has been stabilizing after the reset in structure.
Risks
This article is for informational purposes only and does not constitute financial advice. Some content is AI-generated. See Disclaimer


