Stock Analysis · Bellway PLC (BLWYY)
Overview
Bellway PLC is a U.K. homebuilder focused on residential construction. The company buys land, secures planning permission, develops sites, builds homes, and sells them mainly to individual homebuyers. It also works with housing associations, local authorities, and institutional partners on affordable housing and mixed-tenure developments. In simple terms, Bellway makes money by turning land into completed homes and communities.
Its business is centered on the U.K. housing market, and revenue is overwhelmingly tied to homebuilding activity rather than a broad mix of unrelated businesses. Based on recent annual reporting, the main revenue streams can be summarized as follows:
- Private housing sales: approximately 75% to 80% of revenue. This includes open-market home sales to individuals and families buying newly built houses and apartments.
- Affordable housing sales: approximately 20% to 25% of revenue. These homes are typically sold to housing associations or similar partners under affordable housing programs.
- Other revenue: typically below 5%. This may include land sales and smaller ancillary items, but it is not a major profit driver.
Bellway’s economics are fairly easy to understand: revenue depends on how many homes it completes and the average selling price of those homes. Profitability then depends on land buying discipline, construction costs, labor availability, financing costs, and the health of U.K. housing demand.
Recent revenue flow also shows how cyclical the business is. Sales and gross profit fell sharply in fiscal 2024 as the U.K. housing market cooled, then improved in fiscal 2025. That pattern suggests Bellway is already in a recovery phase, but not yet back to prior peak levels.
Key Figures
| Metric | Value | Sector ⓘ |
|---|---|---|
| Date | Oct 24, 2026 | |
| Context | ||
| Sector | Consumer Cyclical | |
| Industry | Residential Construction | |
| Market Cap ⓘ | $3.49B | |
| Beta ⓘ | 1.34 | |
Value (Cheapness) | ||
| P/E Ratio ⓘ | 13.95 | 17.09 |
| P/B Ratio ⓘ | 1.03 | 1.64 |
| FCF Yield ⓘ | 13.32% | 8.68% |
| Dividend Yield ⓘ | 2.15% | 2.70% |
| EBIT / EV ⓘ | 17.35% | 6.69% |
| PEG ⓘ | 3.00 | |
Growth (Business expansion) | ||
| Revenue Growth ⓘ | 21.30% | 5.60% |
| RPS Growth (5Y CAGR) ⓘ | -2.01% | 9.01% |
| EPS Growth (5Y CAGR) ⓘ | -1.55% | -17.32% |
| BVPS Growth (5Y CAGR) ⓘ | 2.39% | 5.64% |
| Margin Growth (5Y Trend) ⓘ | 1.55% | -0.17% |
| FCF Growth (5Y CAGR) ⓘ | 52.39% | 5.02% |
| DPS Growth (5Y CAGR) ⓘ | -13.86% | 10.19% |
Quality (Business durability) | ||
| ROIC (Latest) ⓘ | N/A | 12.46% |
| ROA (Latest) ⓘ | 6.83% | 5.50% |
| ROIC (5Y Median) ⓘ | 6.19% | 10.68% |
| ROA (5Y Median) ⓘ | 3.69% | 5.44% |
| Net Debt / EBIT (Latest) ⓘ | -0.28 | 2.16 |
| Net Debt / EBIT (5Y Median) ⓘ | 0.30 | 2.29 |
| Net Debt / EBITDA (Latest) ⓘ | -0.27 | 1.48 |
| Net Debt / Assets ⓘ | -3.10% | 21.74% |
| EBITDA / Interest ⓘ | 12.66 | 9.17 |
| Operating Margin (Latest) ⓘ | 9.60% | 9.08% |
| Operating Margin (5Y Median) ⓘ | 9.24% | 9.56% |
| Debt to Equity (Latest) ⓘ | 3.69% | 75.99% |
| Profit Margin (Latest) ⓘ | 6.12% | 5.30% |
| Free Cash Flow (Latest) ⓘ | $464.89M | |
Momentum (Price trend) | ||
| 3Y Return ⓘ | +40.66% | +19.94% |
| 12M Return (excl. last month) ⓘ | +3.16% | -4.14% |
| 6M Return ⓘ | +1.00% | -3.03% |
| Price vs. 200-Day MA ⓘ | +0.48% | -0.66% |
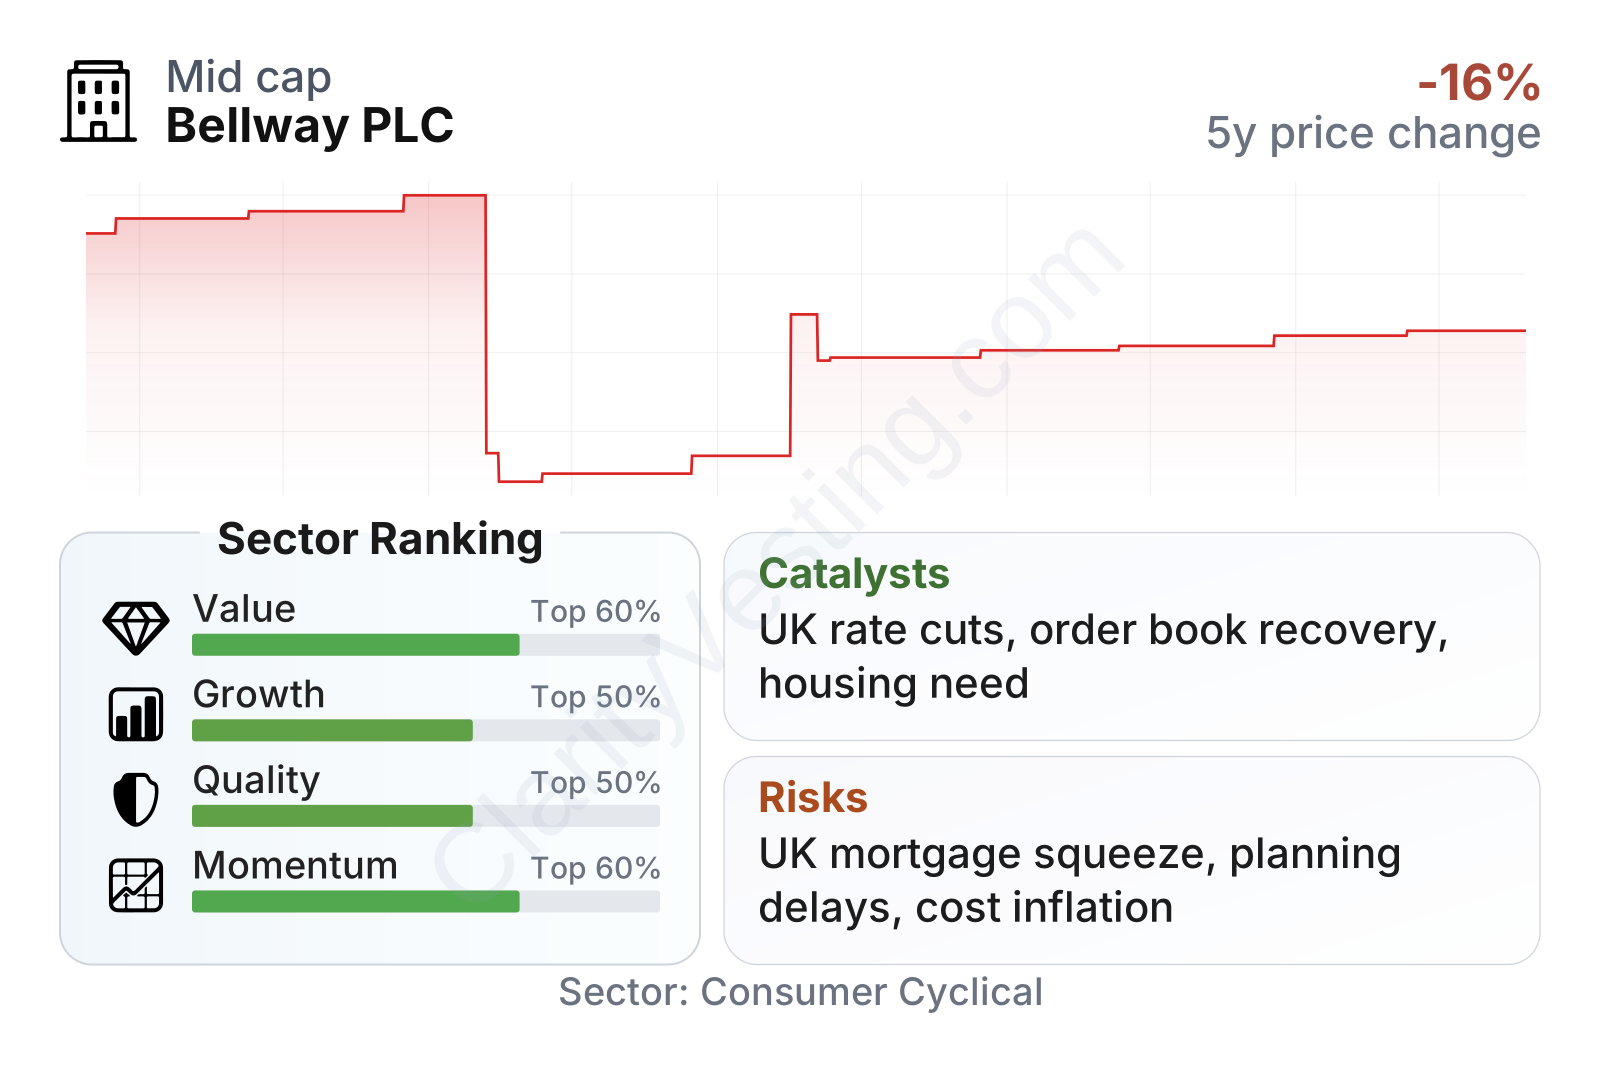
Bellway sits in the mid-sized range by market value and shows a mixed profile. On valuation, its earnings and book multiples are below sector medians, while its EBIT relative to enterprise value looks stronger than many peers. On quality, the most striking feature is the balance sheet: debt to equity is around 5%, far below the sector median near 76%, and interest coverage is solid. Growth measures are less impressive because the last five years include a housing downturn, margin pressure, weaker free cash flow, and lower dividend growth. Share price performance has recovered meaningfully from the 2023 drop, with longer-term momentum still better than the sector median.
The stock history reflects that cycle clearly. After a steep decline in 2023 as the housing market weakened, the shares recovered during 2024 and then moved more steadily. That pattern fits a business whose earnings are highly sensitive to mortgage affordability and housing confidence.
Growth
Bellway operates in a sector with durable long-term demand but uneven short-term conditions. The U.K. has faced a structural housing shortage for years, supported by population trends, household formation, and limited supply in many regions. That gives homebuilders like Bellway a long runway in principle, even though yearly demand can swing sharply with interest rates and consumer confidence.
The company’s strategy is sensible for that setting. Bellway has long emphasized disciplined land buying, a broad regional footprint, and a mix of private and affordable housing. That approach can help smooth results: private demand usually offers higher margins, while affordable housing can provide a steadier outlet during weaker market periods. The group has also continued investing in outlets and land despite the downturn, which can position it for stronger volume when conditions improve.
A major catalyst is the direction of mortgage rates and affordability in the U.K. If financing costs ease further, reservation rates and completions can improve quickly because demand for housing has not disappeared; it has largely been delayed. Another catalyst is planning and policy support for housebuilding. Any improvement in planning efficiency or broader government push to increase housing supply would be favorable for larger, established builders with land expertise and operating scale.
Recent company updates have pointed to improving trading conditions versus the trough period, with stronger customer demand and a larger order book than during the weakest point of the cycle. The rebound in revenue from fiscal 2024 to fiscal 2025 also supports the idea that Bellway is moving off the bottom, although profitability remains well below earlier highs.
Risks
This article is for informational purposes only and does not constitute financial advice. Some content is AI-generated. See Disclaimer


