Stock Analysis · BlackRock Inc (BLK)
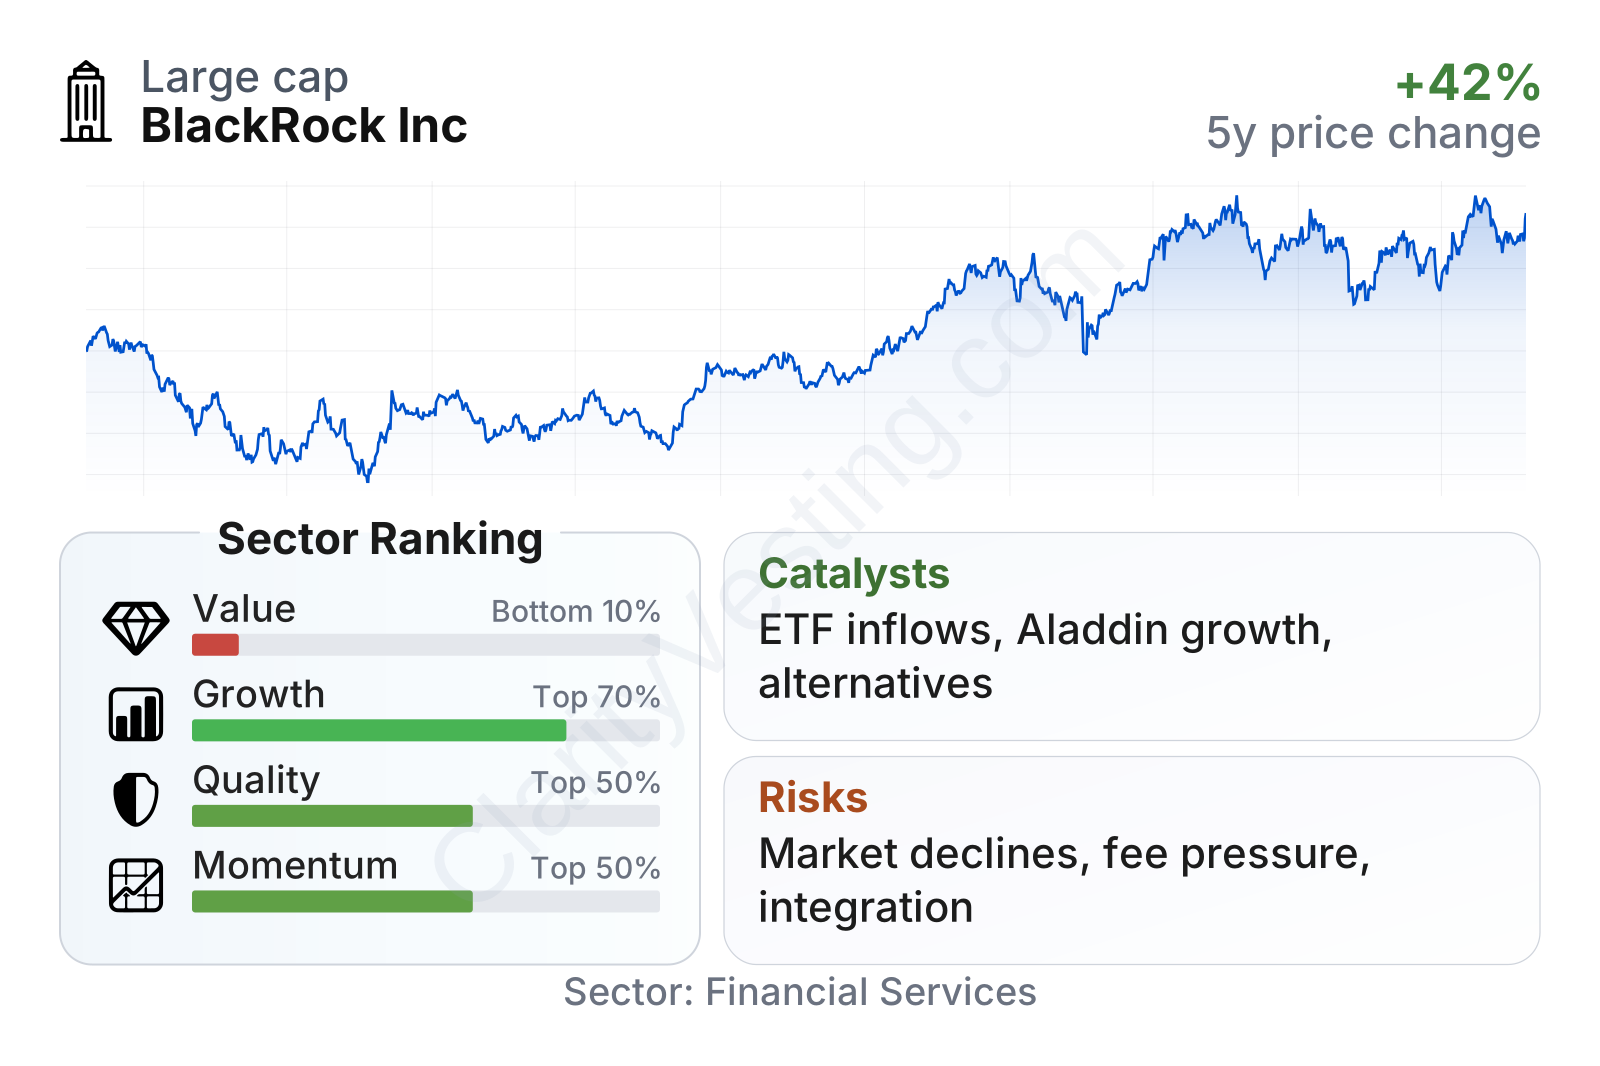
Overview
BlackRock is one of the world’s largest asset managers. In simple terms, it manages money on behalf of clients such as retirement plans, governments, insurers, financial advisors, institutions, and individual savers. The company offers investment funds, exchange-traded funds, portfolio construction tools, risk management technology, and advisory services. Its scale matters because asset management is a business where size can improve distribution, brand recognition, operating efficiency, and product breadth.
Most of BlackRock’s business is built around charging fees on assets it manages. When client assets rise because markets go up or because new money comes in, revenue usually benefits. That makes BlackRock partly a financial services company and partly a market-linked platform. A second important piece is technology, especially Aladdin, BlackRock’s investment and risk management system used by many large institutions.
Based on BlackRock’s recent annual reporting structure, its revenue sources can be understood this way:
- Investment advisory, administration fees, and securities lending revenue: about 80% to 85%. This is the core engine of the company and includes fees from actively managed funds, index strategies, iShares ETFs, cash management, and related administration services.
- Technology services: about 7% to 10%. This mainly includes Aladdin and related software, analytics, and workflow tools used by institutional clients.
- Distribution fees: about 3% to 6%. These are fees tied to distributing certain investment products through intermediaries.
- Advisory and other revenue: about 2% to 5%. This includes consulting, transition management, and other specialized services.
Over the last few years, total revenue has climbed from roughly $19 billion in 2021 to more than $24 billion in 2025, although profit has not risen in a straight line. That pattern fits BlackRock’s model: growth can be strong, but margins and earnings still move with markets, mix, and acquisition-related costs.
The revenue base has expanded meaningfully since 2023, but the cost structure also rose sharply in 2025. That suggests BlackRock is still highly profitable, yet recent growth has come with heavier operating expenses and interest costs than earlier in the cycle.
Key Figures
| Metric | Value | Sector ⓘ |
|---|---|---|
| Date | Oct 19, 2026 | |
| Context | ||
| Sector | Financial Services | |
| Industry | Asset Management | |
| Market Cap ⓘ | $184.31B | |
| Beta ⓘ | 1.42 | |
Value (Cheapness) | ||
| P/E Ratio ⓘ | 25.83 | 12.26 |
| P/B Ratio ⓘ | 3.46 | 1.23 |
| FCF Yield ⓘ | 1.26% | 10.40% |
| Dividend Yield ⓘ | 2.00% | 3.02% |
| EBIT / EV ⓘ | 5.96% | 8.14% |
| PEG ⓘ | 0.89 | |
Growth (Business expansion) | ||
| Revenue Growth ⓘ | 19.10% | 9.25% |
| RPS Growth (5Y CAGR) ⓘ | 4.65% | 12.19% |
| EPS Growth (5Y CAGR) ⓘ | 4.94% | -9.36% |
| BVPS Growth (5Y CAGR) ⓘ | 6.42% | 4.99% |
| Margin Growth (5Y Trend) ⓘ | -9.79% | -3.86% |
| FCF Growth (5Y CAGR) ⓘ | -6.27% | 4.81% |
| DPS Growth (5Y CAGR) ⓘ | 5.97% | 8.79% |
Quality (Business durability) | ||
| ROIC (Latest) ⓘ | 10.49% | 9.49% |
| ROE (Latest) ⓘ | 13.17% | 13.87% |
| ROA (Latest) ⓘ | 3.88% | 1.54% |
| ROIC (5Y Median) ⓘ | 11.26% | 7.86% |
| ROE (5Y Median) ⓘ | 14.66% | 12.17% |
| ROA (5Y Median) ⓘ | 3.83% | 1.30% |
| Net Debt / EBIT (Latest) ⓘ | 0.48 | 0.99 |
| Net Debt / EBIT (5Y Median) ⓘ | 0.17 | 0.73 |
| Net Debt / EBITDA (Latest) ⓘ | 0.41 | 0.91 |
| Operating Margin (Latest) ⓘ | 34.56% | 22.30% |
| Operating Margin (5Y Median) ⓘ | 36.25% | 24.63% |
| Debt to Equity (Latest) ⓘ | 25.98% | 58.04% |
| Profit Margin (Latest) ⓘ | 24.22% | 26.57% |
| Free Cash Flow (Latest) ⓘ | $2.32B | |
Momentum (Price trend) | ||
| 3Y Return ⓘ | +90.66% | +88.26% |
| 12M Return (excl. last month) ⓘ | -5.32% | +19.24% |
| 6M Return ⓘ | +11.87% | +4.70% |
| Price vs. 200-Day MA ⓘ | +7.82% | +3.66% |
BlackRock stands out as a very large company with solid business quality and above-median recent growth, but its valuation is clearly richer than most financial stocks. Profitability remains strong, balance-sheet leverage looks controlled, and long-term earnings growth has stayed positive. The weaker point is value: earnings, book value, and cash flow multiples all sit above sector norms, while the dividend yield is lower than the sector median.
The stock price history also shows that BlackRock can be volatile. After a sharp decline in 2022, the shares recovered strongly and moved to much higher levels through 2024 and 2025 before fluctuating again in 2026. That pattern reflects both company progress and the fact that asset managers are very sensitive to market sentiment.
Growth
BlackRock operates in a sector with durable long-term tailwinds. Global savings continue to shift toward retirement products, low-cost investment vehicles, outsourced portfolio management, and digital investment infrastructure. Exchange-traded funds remain one of the clearest structural growth areas in finance, and BlackRock’s iShares franchise is one of the strongest brands in that market. The company is also positioned to benefit from institutions wanting better risk tools, operating systems, and data integration, which supports the technology segment.
Its strategy for future growth is coherent. BlackRock combines three reinforcing businesses: large-scale asset gathering, broad product manufacturing, and fee-based technology. That mix is useful because it reduces dependence on any single product category. The company has also been pushing further into alternatives, private markets, infrastructure, and whole-portfolio solutions, areas where client demand has been increasing as traditional stock-and-bond allocations become less sufficient on their own.
Recent corporate moves also matter. BlackRock has been expanding its alternatives capabilities through major acquisitions and partnerships in private markets and infrastructure. If integration goes well, that could deepen its presence in higher-fee segments that are less commoditized than traditional index investing. At the same time, the firm remains well placed in ETFs, where scale and distribution are powerful advantages.
Earnings per share have trended upward over the last several years despite market swings, with a setback in 2022 followed by a recovery and new highs afterward. That is an encouraging sign for a business tied to market levels, because it suggests BlackRock has continued to grow through both asset inflows and operating leverage.
Book value per share has also moved higher, especially since 2024. For a financial company, that signals that underlying shareholder value has been building rather than stagnating. It does not guarantee future returns, but it supports the idea that growth has not relied only on market optimism.
Risks
This article is for informational purposes only and does not constitute financial advice. Some content is AI-generated. See Disclaimer


