Stock Analysis · Baker Hughes Co (BKR)
Overview
Baker Hughes is a large energy technology company that sells equipment, systems, and services used to find, produce, move, and process energy. Its business reaches across traditional oil and gas operations, liquefied natural gas, power generation, industrial compression, and a growing set of lower-carbon technologies such as carbon capture, hydrogen, and geothermal solutions. In simple terms, the company helps energy producers and industrial customers run complex assets more efficiently and more reliably.
The company reports through two main segments, and these are also its main sources of revenue. Based on recent annual reporting, the mix is approximately:
- Oilfield Services & Equipment: about 60% of revenue. This segment includes drilling services, well construction, completions, production solutions, subsea systems, flexible pipe, and other equipment and services used by upstream oil and gas customers.
- Industrial & Energy Technology: about 40% of revenue. This includes gas technology equipment, turbomachinery, compressors, pumps, controls, asset performance software, and systems tied to LNG, pipeline, industrial, and energy transition projects.
That mix matters because Baker Hughes is not purely tied to drilling activity. A meaningful part of the business comes from long-cycle infrastructure and industrial spending, which can make results less volatile than a pure oilfield services company. Another useful point for long-term readers is that the company has been shifting toward a broader “energy and industrial technology” identity rather than relying only on North American shale activity.
The business profile has improved in recent years. Revenue climbed from roughly $20.5 billion in 2021 to about $27.8 billion in 2024, while operating income and net income recovered sharply after weak results earlier in the cycle. Even with a flatter top line more recently, profitability remains much stronger than it was a few years ago.
The income flow shows a clear recovery since 2022: revenue expanded materially through 2024, operating profit improved even faster, and interest costs stayed relatively contained. The more recent picture suggests a company that has moved from cyclical repair into steadier cash generation, although growth has become less linear.
Key Figures
| Metric | Value | Sector ⓘ |
|---|---|---|
| Date | Oct 24, 2026 | |
| Context | ||
| Sector | Energy | |
| Industry | Oil & Gas Equipment & Services | |
| Market Cap ⓘ | $55.24B | |
| Beta ⓘ | 1.03 | |
Value (Cheapness) | ||
| P/E Ratio ⓘ | 17.89 | 15.40 |
| P/B Ratio ⓘ | 2.83 | 1.71 |
| FCF Yield ⓘ | 5.66% | 8.24% |
| Dividend Yield ⓘ | 1.65% | 3.52% |
| EBIT / EV ⓘ | 6.51% | 7.45% |
| PEG ⓘ | 1.62 | |
Growth (Business expansion) | ||
| Revenue Growth ⓘ | -2.40% | 26.85% |
| RPS Growth (5Y CAGR) ⓘ | 2.90% | 6.78% |
| EPS Growth (5Y CAGR) ⓘ | 8.45% | -14.41% |
| BVPS Growth (5Y CAGR) ⓘ | 4.61% | 6.08% |
| Margin Growth (5Y Trend) ⓘ | 7.63% | 0.55% |
| FCF Growth (5Y CAGR) ⓘ | 8.46% | 2.75% |
| DPS Growth (5Y CAGR) ⓘ | 0.18% | 16.79% |
Quality (Business durability) | ||
| ROIC (Latest) ⓘ | 12.70% | 11.30% |
| ROA (Latest) ⓘ | 6.74% | 6.00% |
| ROIC (5Y Median) ⓘ | 11.82% | 10.35% |
| ROA (5Y Median) ⓘ | 5.46% | 5.46% |
| Net Debt / EBIT (Latest) ⓘ | 0.14 | 1.64 |
| Net Debt / EBIT (5Y Median) ⓘ | 1.46 | 1.82 |
| Net Debt / EBITDA (Latest) ⓘ | 0.10 | 1.08 |
| Net Debt / Assets ⓘ | 1.00% | 17.29% |
| EBITDA / Interest ⓘ | 18.88 | 9.53 |
| Operating Margin (Latest) ⓘ | 13.65% | 16.21% |
| Operating Margin (5Y Median) ⓘ | 9.08% | 20.55% |
| Debt to Equity (Latest) ⓘ | 81.64% | 52.27% |
| Profit Margin (Latest) ⓘ | 11.17% | 8.79% |
| Free Cash Flow (Latest) ⓘ | $3.13B | |
Momentum (Price trend) | ||
| 3Y Return ⓘ | +71.20% | +68.93% |
| 12M Return (excl. last month) ⓘ | +24.07% | +42.90% |
| 6M Return ⓘ | -6.40% | +9.18% |
| Price vs. 200-Day MA ⓘ | -6.28% | +9.87% |
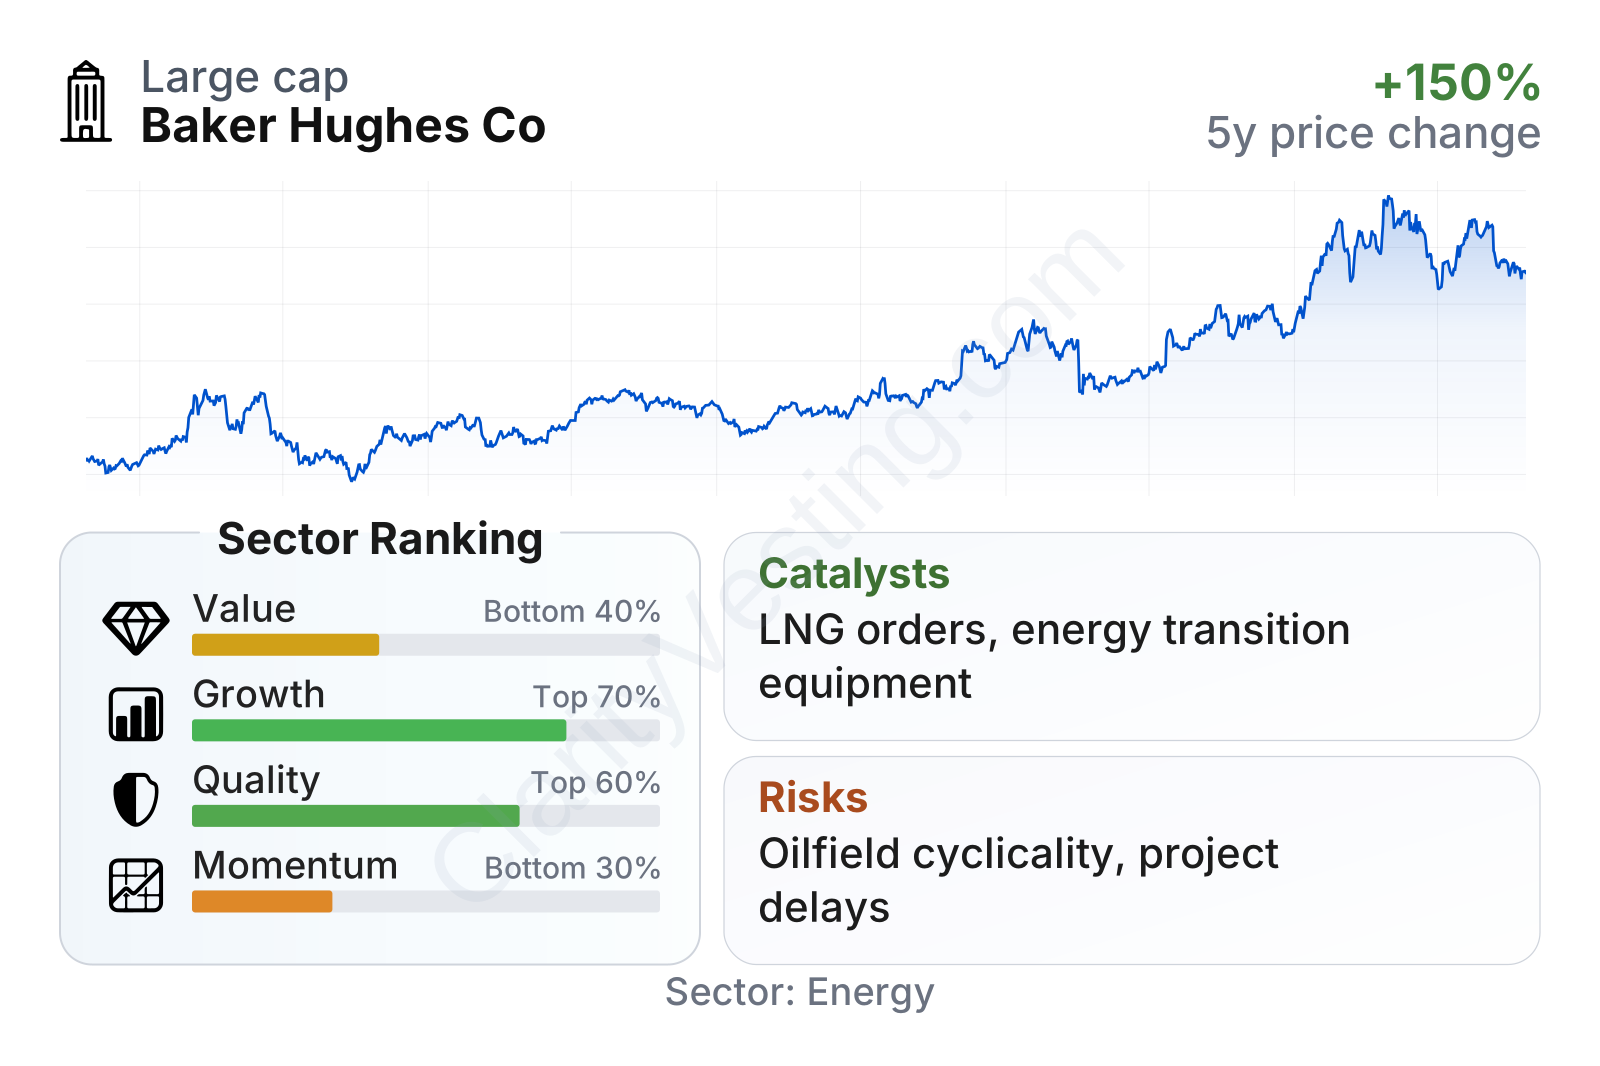
Baker Hughes is a very large company in its industry, with share-price volatility close to the broader market rather than extreme commodity-linked behavior. The overall factor mix points to a business with improving fundamentals but a valuation that is no longer especially cheap. Growth and cash generation look healthier than they did a few years ago, while value metrics sit below the sector’s more attractive range. Quality is mixed: profitability and interest coverage are solid, but capital efficiency and leverage ratios do not stand out consistently across every measure.
Growth
Baker Hughes operates in parts of the energy market that still have long runways for investment. Oil and gas remain essential to global supply, and many customers continue to spend on efficiency, production optimization, LNG infrastructure, and equipment modernization. At the same time, the company has positioned itself in areas that can benefit from the energy transition without requiring a full break from its legacy business. That includes carbon capture, hydrogen, geothermal, and electrification-related technologies, alongside its established turbomachinery and compression franchises.
The strategy makes sense because it combines short-cycle and long-cycle exposures. Oilfield services can respond faster to customer activity, while LNG, gas infrastructure, and industrial equipment orders can provide longer-duration backlog and better visibility. This balance is one of Baker Hughes’ more important strengths compared with narrower peers.
Recent revenue growth has clearly cooled after a strong rebound in 2023 and solid expansion in 2024. That slowdown does not erase the larger improvement over the last several years, but it does show that Baker Hughes is now moving past the easiest part of the recovery. For a long-term view, the more important question is whether margins and cash flow can keep improving even when sales growth is uneven.
Free cash flow remains one of the more encouraging signals. It has risen well above the levels seen earlier in the cycle and remains in the multi-billion-dollar range. That matters because cash generation gives Baker Hughes more flexibility for dividends, buybacks, acquisitions, and internal investment without putting stress on the balance sheet.
One of the strongest catalysts for future growth is LNG. Baker Hughes has meaningful exposure to liquefaction projects and related equipment, and global demand for gas infrastructure continues to be supported by energy security concerns and export capacity expansion. Another catalyst is digital and equipment upgrades that help customers lower emissions and improve efficiency, an area where Baker Hughes can sell technology into existing industrial and energy systems rather than depending only on new drilling activity.
Recent company updates have also pointed to continued order activity in industrial and energy technology markets, especially where gas infrastructure and large project equipment are involved. That does not guarantee smooth quarterly growth, but it supports the idea that parts of the portfolio are tied to durable capital spending themes rather than purely spot commodity conditions.
Risks
This article is for informational purposes only and does not constitute financial advice. Some content is AI-generated. See Disclaimer


