Stock Analysis · Bank Of Queensland Ltd (BKQNY)
Overview
Bank of Queensland Ltd is an Australian regional banking group focused on retail and business banking. It operates under the Bank of Queensland brand as well as other specialist brands, serving households, small and medium-sized businesses, and selected commercial clients. In practical terms, the group mainly takes deposits, makes home loans and business loans, and earns income from the spread between what it charges borrowers and what it pays depositors. It also generates fees from banking services and contributes earnings from related activities such as insurance distribution and specialist lending.
The business is still primarily a classic bank, so revenue is driven much more by lending and deposit margins than by fee-heavy activities. Based on the company’s recent annual reporting structure, the main economic sources of income can be summarized as follows:
- Net interest income: approximately 75% to 85% of total operating income. This is the core banking spread from home loans, commercial lending, equipment finance, and deposits.
- Fee and commission income: approximately 10% to 15%. This includes account fees, lending-related fees, and some service charges.
- Other operating income: approximately 5% to 10%. This can include insurance-related contributions, treasury and market activities, and various non-lending banking income.
Compared with larger Australian banks, Bank of Queensland is much smaller and more concentrated, which makes execution and funding discipline especially important. The business mix is relatively straightforward, but profitability has been more volatile than that of the major banks.
The profit flow also shows that revenue has stayed in a fairly stable range over recent years, while earnings have been much less stable because funding costs, operating expenses, and credit conditions have had a larger effect on the bottom line than on revenue itself.
A useful takeaway from the profit flow is that total revenue has not moved dramatically, but net income has. That points to a bank whose headline activity level is relatively steady, yet whose profitability is highly sensitive to margin pressure and cost control.
Key Figures
| Metric | Value | Sector ⓘ |
|---|---|---|
| Date | Oct 24, 2026 | |
| Context | ||
| Sector | Financial Services | |
| Industry | Banks - Regional | |
| Market Cap ⓘ | $2.87B | |
| Beta ⓘ | 0.67 | |
Value (Cheapness) | ||
| P/E Ratio ⓘ | 17.15 | 12.46 |
| P/B Ratio ⓘ | 0.53 | 1.25 |
| FCF Yield ⓘ | 110.62% | 9.82% |
| Dividend Yield ⓘ | 6.20% | 2.94% |
| EBIT / EV ⓘ | 3.64% | 8.11% |
| PEG ⓘ | 8.19 | |
Growth (Business expansion) | ||
| Revenue Growth ⓘ | -11.50% | 9.10% |
| RPS Growth (5Y CAGR) ⓘ | 28.24% | 12.31% |
| EPS Growth (5Y CAGR) ⓘ | -3.33% | -6.97% |
| BVPS Growth (5Y CAGR) ⓘ | -4.77% | 5.02% |
| Margin Growth (5Y Trend) ⓘ | -28.79% | -4.00% |
| FCF Growth (5Y CAGR) ⓘ | -9.20% | 4.71% |
| DPS Growth (5Y CAGR) ⓘ | 9.96% | 8.92% |
Quality (Business durability) | ||
| ROIC (Latest) ⓘ | N/A | 9.18% |
| ROE (Latest) ⓘ | 4.91% | 13.93% |
| ROA (Latest) ⓘ | 0.30% | 1.57% |
| ROIC (5Y Median) ⓘ | 1.09% | 7.80% |
| ROE (5Y Median) ⓘ | 4.15% | 12.15% |
| ROA (5Y Median) ⓘ | 0.25% | 1.28% |
| Net Debt / EBIT (Latest) ⓘ | 25.62 | 1.02 |
| Net Debt / EBIT (5Y Median) ⓘ | 36.68 | 0.72 |
| Net Debt / EBITDA (Latest) ⓘ | 20.02 | 0.88 |
| Operating Margin (Latest) ⓘ | 6.78% | 22.30% |
| Operating Margin (5Y Median) ⓘ | 16.62% | 24.50% |
| Debt to Equity (Latest) ⓘ | 266.07% | 59.34% |
| Profit Margin (Latest) ⓘ | 15.96% | 26.42% |
| Free Cash Flow (Latest) ⓘ | $3.17B | |
Momentum (Price trend) | ||
| 3Y Return ⓘ | +49.35% | +95.73% |
| 12M Return (excl. last month) ⓘ | +0.55% | +17.30% |
| 6M Return ⓘ | -14.29% | +6.07% |
| Price vs. 200-Day MA ⓘ | +6.70% | +5.36% |
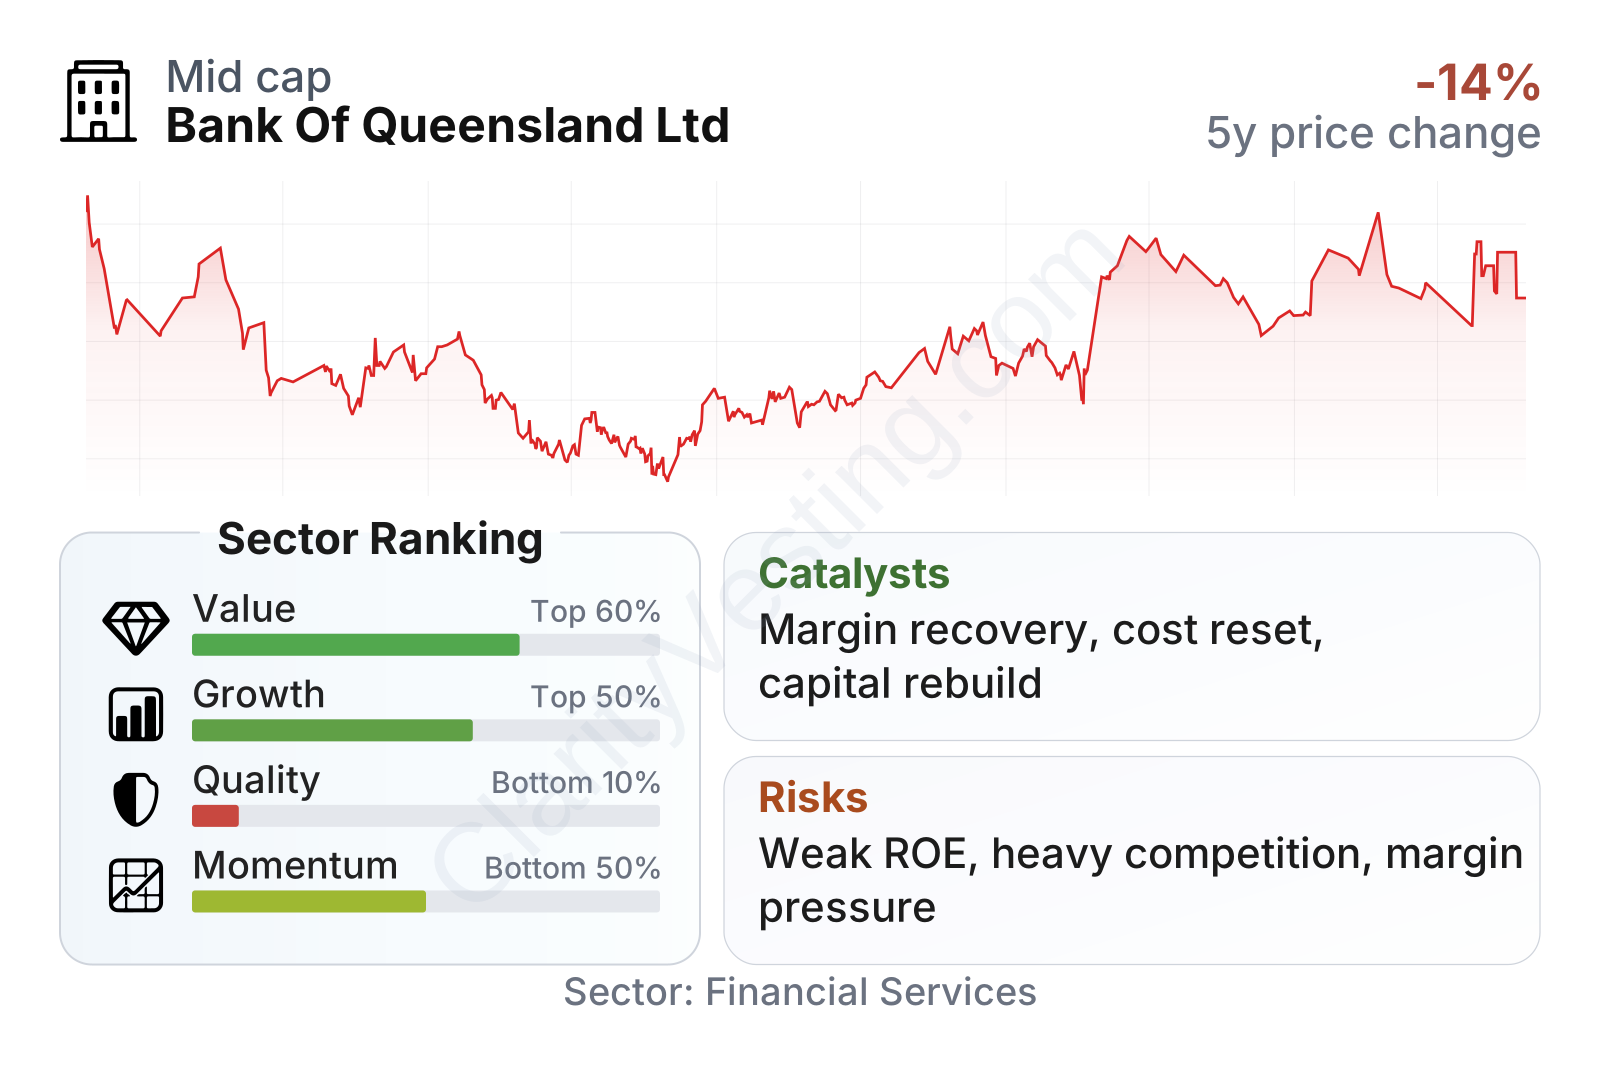
Bank of Queensland sits in the smaller end of listed banks by market value, and its share price history shows a deep decline from 2021 into 2023 followed by a notable recovery into 2026. Recent trading momentum has improved versus its own long-term trend, but the broader picture still reflects a business that has spent several years rebuilding confidence.
The factor breakdown is mixed. On valuation, the stock looks inexpensive on price-to-book, with a multiple far below the sector median, and the dividend yield is also above the sector norm. However, the earnings multiple is elevated, which usually signals that current profits are still depressed rather than that the market is placing a premium on the franchise.
Quality is the weakest area. Returns on equity and assets are well below sector medians, profit margin is thin for a bank, and leverage metrics are heavier than many peers. Growth is also uneven: revenue has risen modestly over time, but earnings, margins, and book value per share have been under pressure over a multi-year period.
Growth
Banking is not a high-growth sector in the same way as software or semiconductors, but it is a durable one. In Australia, population growth, housing demand, business lending needs, and deposit gathering create a long runway for banks that can protect margins and manage risk well. For Bank of Queensland, the growth question is less about entering a new booming market and more about improving profitability within a mature but essential sector.
The company’s strategy has centered on simplifying operations, strengthening its technology platform, and reshaping the balance between retail, business, and specialist lending. This makes strategic sense because regional banks need to be efficient to compete with larger institutions that have broader scale and lower unit costs. If management can improve cost efficiency, stabilize funding, and keep loan losses contained, earnings can recover even without strong top-line growth.
The earnings profile remains the main issue. Even though long-term earnings growth compares better than some weaker parts of the regional banking universe, the absolute trend has still been underwhelming, and the current earnings base appears too low to support a strong quality profile. That means future upside depends heavily on margin normalization and cleaner execution rather than fast balance-sheet expansion.
Book value per share is especially important for banks because it represents the capital base that supports lending. Here, the picture has been choppy. After declining for several years, book value per share recovered meaningfully in the latest period. That is encouraging because it suggests the balance sheet is no longer moving in only one direction. A sustained rise would matter more than a one-year rebound.
Recent company updates have emphasized operational simplification, capital discipline, and selective growth in target lending segments. A meaningful catalyst would be any evidence that these efforts are translating into better net interest margin, lower cost growth, and steadier returns on equity. In a bank of this size, even moderate operational improvement can have an outsized effect on profit.
Risks
This article is for informational purposes only and does not constitute financial advice. Some content is AI-generated. See Disclaimer


