Stock Analysis · Brookfield Infrastructure Corp (BIPC)
Overview
Brookfield Infrastructure Corp is a publicly traded vehicle tied to Brookfield Infrastructure’s global portfolio of essential infrastructure assets. In simple terms, it owns and operates long-life businesses that people and companies rely on every day: electricity transmission, natural gas transport and distribution, freight rail, toll roads, ports, data infrastructure, and midstream energy systems. The corporate structure is a little unusual because BIPC is the corporation that is economically equivalent to Brookfield Infrastructure Partners, or BIP. Both give exposure to the same underlying business.
The company’s business model is built around infrastructure that is difficult and expensive to replace. These assets often operate under long-term contracts, regulated frameworks, or highly entrenched market positions. That tends to support recurring cash generation, although reported earnings can still swing because of financing costs, asset sales, and accounting items.
Brookfield Infrastructure’s revenue comes from several segments spread across utilities, transport, midstream, and data operations. Based on recent company reporting, the mix is diversified rather than dominated by a single activity. Approximate revenue contribution can shift from year to year because of acquisitions, disposals, and currency movements, but the broad ranking is typically as follows:
- Transport: approximately 30% to 35% of revenue. This includes rail networks, toll roads, ports, and logistics infrastructure.
- Utilities: approximately 25% to 30% of revenue. This includes regulated distribution lines, electricity transmission, and natural gas utility assets.
- Midstream: approximately 20% to 25% of revenue. This includes natural gas pipelines, storage, and related energy infrastructure.
- Data: approximately 15% to 20% of revenue. This includes telecom towers, fiber networks, and data-related connectivity assets.
The most important point for long-term readers is that this is not a narrow utility stock despite the sector label often attached to it in market databases. It is better understood as a diversified infrastructure operator with global exposure and a parent group that has a long history of buying, improving, and recycling essential assets.
Revenue has expanded strongly over the past several years, and operating income has also remained substantial. At the same time, interest expense has climbed materially, which has weighed on net income. That helps explain why the business can look strong at the operating level while bottom-line profit appears weak or even negative in some periods.
Key Figures
| Metric | Value | Sector ⓘ |
|---|---|---|
| Date | Oct 17, 2026 | |
| Context | ||
| Sector | Utilities | |
| Industry | Utilities - Regulated Gas | |
| Market Cap ⓘ | $4.51B | |
| Beta ⓘ | 1.31 | |
Value (Cheapness) | ||
| P/E Ratio ⓘ | N/A | 17.28 |
| P/B Ratio ⓘ | N/A | 1.51 |
| FCF Yield ⓘ | -4.74% | 0.65% |
| Dividend Yield ⓘ | 4.97% | 3.77% |
| EBIT / EV ⓘ | 13.98% | 5.01% |
| PEG ⓘ | N/A | |
Growth (Business expansion) | ||
| Revenue Growth ⓘ | 8.50% | 6.10% |
| RPS Growth (5Y CAGR) ⓘ | 20.69% | 3.87% |
| EPS Growth (5Y CAGR) ⓘ | N/A | -11.30% |
| BVPS Growth (5Y CAGR) ⓘ | -13.32% | 4.23% |
| Margin Growth (5Y Trend) ⓘ | 16.20% | 3.57% |
| FCF Growth (5Y CAGR) ⓘ | -15.25% | -8.84% |
| DPS Growth (5Y CAGR) ⓘ | N/A | 4.84% |
Quality (Business durability) | ||
| ROIC (Latest) ⓘ | -14.23% | 6.53% |
| ROA (Latest) ⓘ | -1.45% | 3.20% |
| ROIC (5Y Median) ⓘ | 12.65% | 5.95% |
| ROA (5Y Median) ⓘ | -1.03% | 2.75% |
| Net Debt / EBIT (Latest) ⓘ | 5.24 | 7.13 |
| Net Debt / EBIT (5Y Median) ⓘ | 5.70 | 7.23 |
| Net Debt / EBITDA (Latest) ⓘ | 4.11 | 4.31 |
| Net Debt / Assets ⓘ | 49.29% | 38.42% |
| EBITDA / Interest ⓘ | 2.36 | 4.58 |
| Operating Margin (Latest) ⓘ | 62.14% | 20.83% |
| Operating Margin (5Y Median) ⓘ | 60.39% | 20.08% |
| Debt to Equity (Latest) ⓘ | -830.26% | 137.69% |
| Profit Margin (Latest) ⓘ | -9.41% | 11.37% |
| Free Cash Flow (Latest) ⓘ | -$213.49M | |
Momentum (Price trend) | ||
| 3Y Return ⓘ | +34.83% | +52.37% |
| 12M Return (excl. last month) ⓘ | -6.72% | +8.84% |
| 6M Return ⓘ | -11.88% | -3.95% |
| Price vs. 200-Day MA ⓘ | -9.75% | -0.79% |
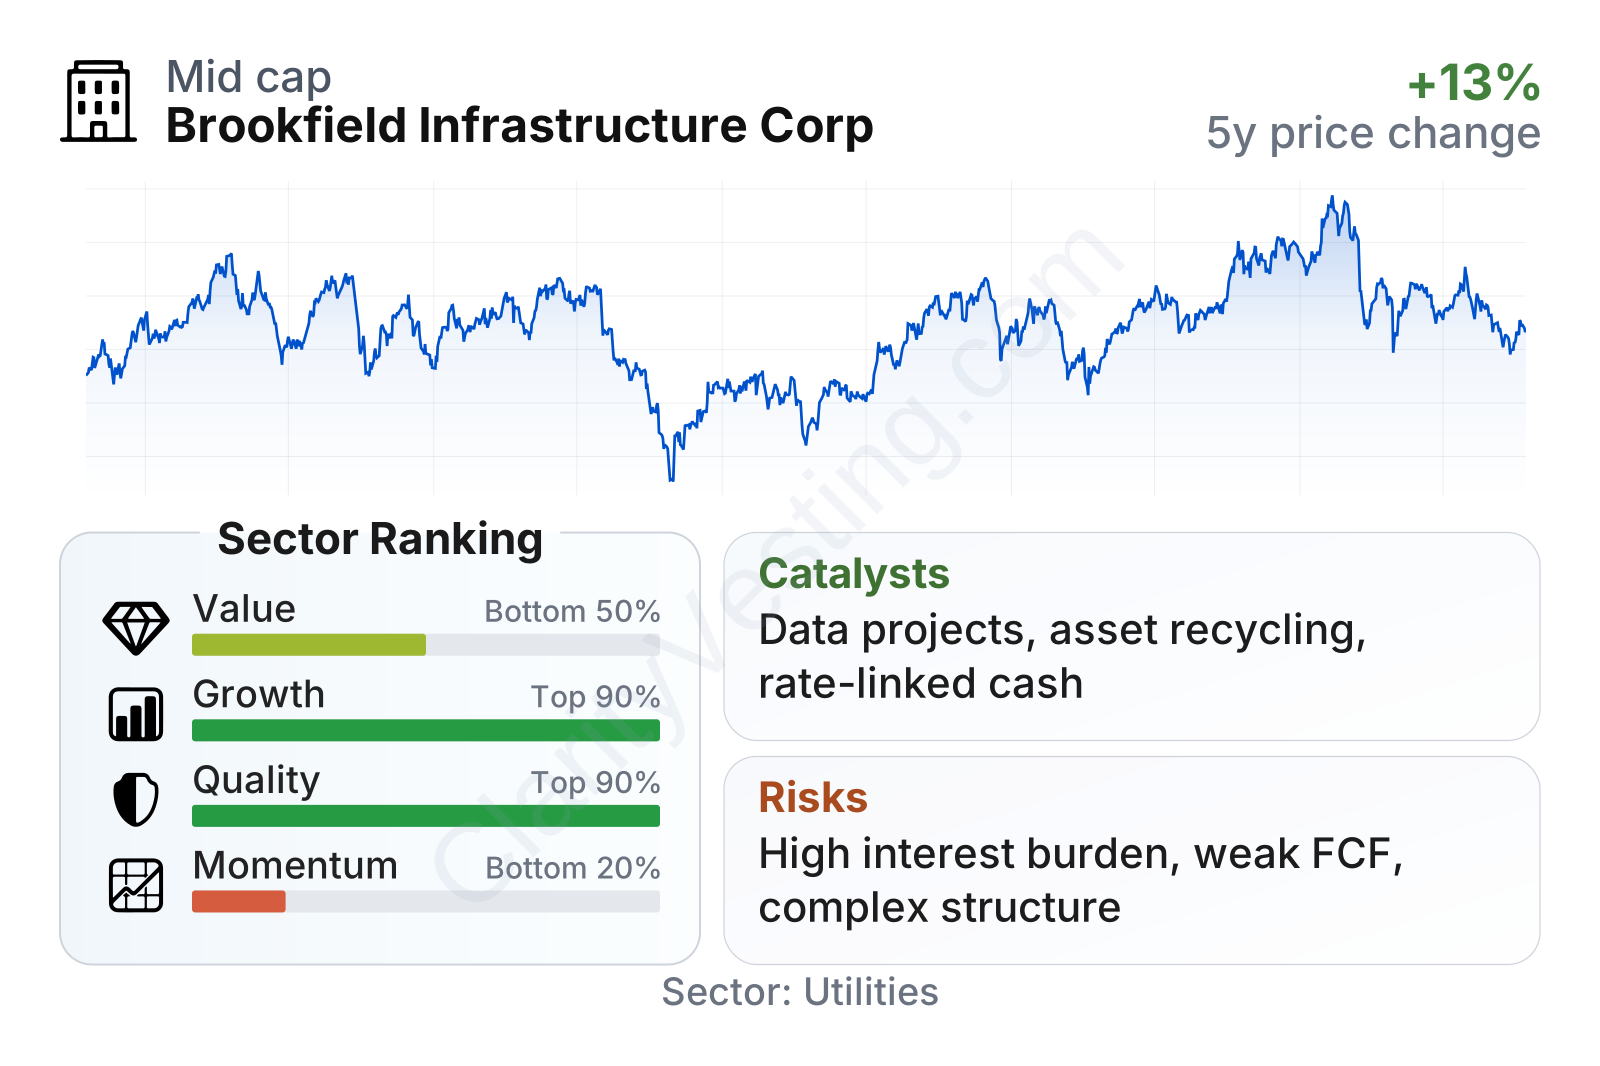
Brookfield Infrastructure sits in the smaller end of the large listed infrastructure universe by market value, and its share price has been more volatile than a typical regulated utility, with a beta around 1.3. The metrics show a mixed picture: growth and operating quality rank well versus the sector, while value signals are less straightforward and price momentum has been weak. The most notable strengths are strong multi-year revenue expansion and unusually high operating margins for the sector. The main weak spots are negative recent free cash flow, weak recent profitability at the net income level, and a softer stock performance than many peers.
Growth
Brookfield Infrastructure operates in sectors with durable long-term demand. Electric grids need upgrades, natural gas and energy systems still require investment, data traffic keeps rising, and transportation networks remain essential to trade and supply chains. Those are not short-lived themes. They are tied to population growth, digitalization, electrification, and the replacement of aging infrastructure.
The company’s strategy is also built for long-term expansion. Brookfield typically acquires infrastructure where it sees a chance to improve operations, invest additional capital, and later recycle mature assets into new opportunities. That approach can support growth even when a mature utility or pipeline business by itself would only grow slowly.
Revenue per share has increased sharply over the last five years, far faster than the sector median. That is an encouraging sign because it suggests expansion has not come only from issuing more equity; it has also translated into more business activity on a per-share basis. Revenue growth in the latest period also remained ahead of the sector median, which supports the view that the platform is still expanding rather than simply harvesting mature assets.
One caution is that free cash flow has become more volatile and recently turned negative. For an infrastructure owner, that does not automatically mean the business is deteriorating. It can reflect heavy capital spending, working capital swings, or the timing of investments and disposals. Still, sustained negative free cash flow would matter because the company relies on both capital markets and asset recycling to fund growth.
Several business catalysts remain visible. Brookfield Infrastructure has continued to emphasize capital deployment into data infrastructure, utility modernization, and energy transition-related projects, areas where demand is likely to remain high. The broader Brookfield platform also gives it access to large transactions and funding channels that smaller competitors often cannot match. In addition, the company has historically benefited from inflation-linked contracts and regulated rate frameworks in parts of its portfolio, which can help protect cash generation when costs rise.
Recent company communications have continued to point to a healthy pipeline of organic expansion projects and acquisitions across data, transport, and utility infrastructure. That matters because the strongest long-term compounding in this type of business usually comes from combining stable base cash flows with disciplined reinvestment.
Risks
This article is for informational purposes only and does not constitute financial advice. Some content is AI-generated. See Disclaimer


