Stock Analysis · Brighthouse Financial Inc (BHF)
Overview
Brighthouse Financial is a U.S. life insurance and retirement-focused financial company. It was separated from MetLife in 2017 and now concentrates mainly on products that help individuals build retirement savings, convert savings into income, and protect families through life insurance. Its business is less about fast-growing consumer finance and more about managing long-dated promises tied to annuities, life policies, investment returns, and interest rates.
The company’s revenue mix can look unusual compared with non-financial businesses because insurance accounting includes premiums, policy charges, investment income, derivatives, and mark-to-market movements. In practical terms, Brighthouse mainly earns money from spread-based earnings on annuities, fees and policy charges, premiums, and investment income on the assets backing policyholder obligations. Based on its recent filings, the business is centered on three major operating areas:
- Annuities: the largest business, representing the clear majority of earnings power. This includes variable annuities, fixed annuities, index-linked annuities, and income annuities sold to retirement savers.
- Life insurance: a meaningful secondary business, primarily universal life, term, and whole life products that generate premiums and policy-related charges.
- Run-off and corporate activities: a smaller piece that includes legacy blocks, investment results, hedging effects, and corporate items.
For a simple long-term view, Brighthouse is best understood as a retirement and protection company whose economics are driven mostly by annuity assets, policyholder behavior, capital management, and disciplined risk hedging rather than by steady product volume alone.
Profitability has also been volatile over the last several years, which is common for insurers with large market-sensitive businesses. Revenue fell sharply in 2023 and then recovered in 2024 and 2025, while operating income and net income moved from losses back to profits. That pattern suggests the underlying franchise is still active, but reported results can swing widely from year to year.
The business mix shows that Brighthouse has been recovering from a difficult 2023. Revenue and operating profit improved in 2024 and 2025, but earnings remain more cyclical and market-sensitive than those of simpler insurers.
Key Figures
| Metric | Value | Sector ⓘ |
|---|---|---|
| Date | Oct 24, 2026 | |
| Context | ||
| Sector | Financial Services | |
| Industry | Insurance - Life | |
| Market Cap ⓘ | $2.70B | |
| Beta ⓘ | 0.83 | |
Value (Cheapness) | ||
| P/E Ratio ⓘ | 3.71 | 12.46 |
| P/B Ratio ⓘ | 0.41 | 1.25 |
| FCF Yield ⓘ | -33.29% | 9.82% |
| Dividend Yield ⓘ | N/A | 2.94% |
| EBIT / EV ⓘ | 18.72% | 8.11% |
| PEG ⓘ | N/A | |
Growth (Business expansion) | ||
| Revenue Growth ⓘ | 86.70% | 9.10% |
| RPS Growth (5Y CAGR) ⓘ | 6.25% | 12.31% |
| EPS Growth (5Y CAGR) ⓘ | -0.36% | -6.97% |
| BVPS Growth (5Y CAGR) ⓘ | -55.72% | 5.02% |
| Margin Growth (5Y Trend) ⓘ | 19.31% | -4.00% |
| FCF Growth (5Y CAGR) ⓘ | N/A | 4.71% |
| DPS Growth (5Y CAGR) ⓘ | 13.84% | 8.92% |
Quality (Business durability) | ||
| ROIC (Latest) ⓘ | 9.79% | 9.18% |
| ROE (Latest) ⓘ | 13.00% | 13.93% |
| ROA (Latest) ⓘ | 0.34% | 1.57% |
| ROIC (5Y Median) ⓘ | 6.41% | 7.80% |
| ROE (5Y Median) ⓘ | -0.08% | 12.15% |
| ROA (5Y Median) ⓘ | 0.16% | 1.28% |
| Net Debt / EBIT (Latest) ⓘ | -3.63 | 1.02 |
| Net Debt / EBIT (5Y Median) ⓘ | -3.29 | 0.72 |
| Net Debt / EBITDA (Latest) ⓘ | -3.51 | 0.88 |
| Operating Margin (Latest) ⓘ | 17.33% | 22.30% |
| Operating Margin (5Y Median) ⓘ | 10.08% | 24.50% |
| Debt to Equity (Latest) ⓘ | 48.15% | 59.34% |
| Profit Margin (Latest) ⓘ | 12.15% | 26.42% |
| Free Cash Flow (Latest) ⓘ | -$899.00M | |
Momentum (Price trend) | ||
| 3Y Return ⓘ | +2.52% | +95.73% |
| 12M Return (excl. last month) ⓘ | -5.93% | +17.30% |
| 6M Return ⓘ | -25.34% | +6.07% |
| Price vs. 200-Day MA ⓘ | -22.32% | +5.36% |
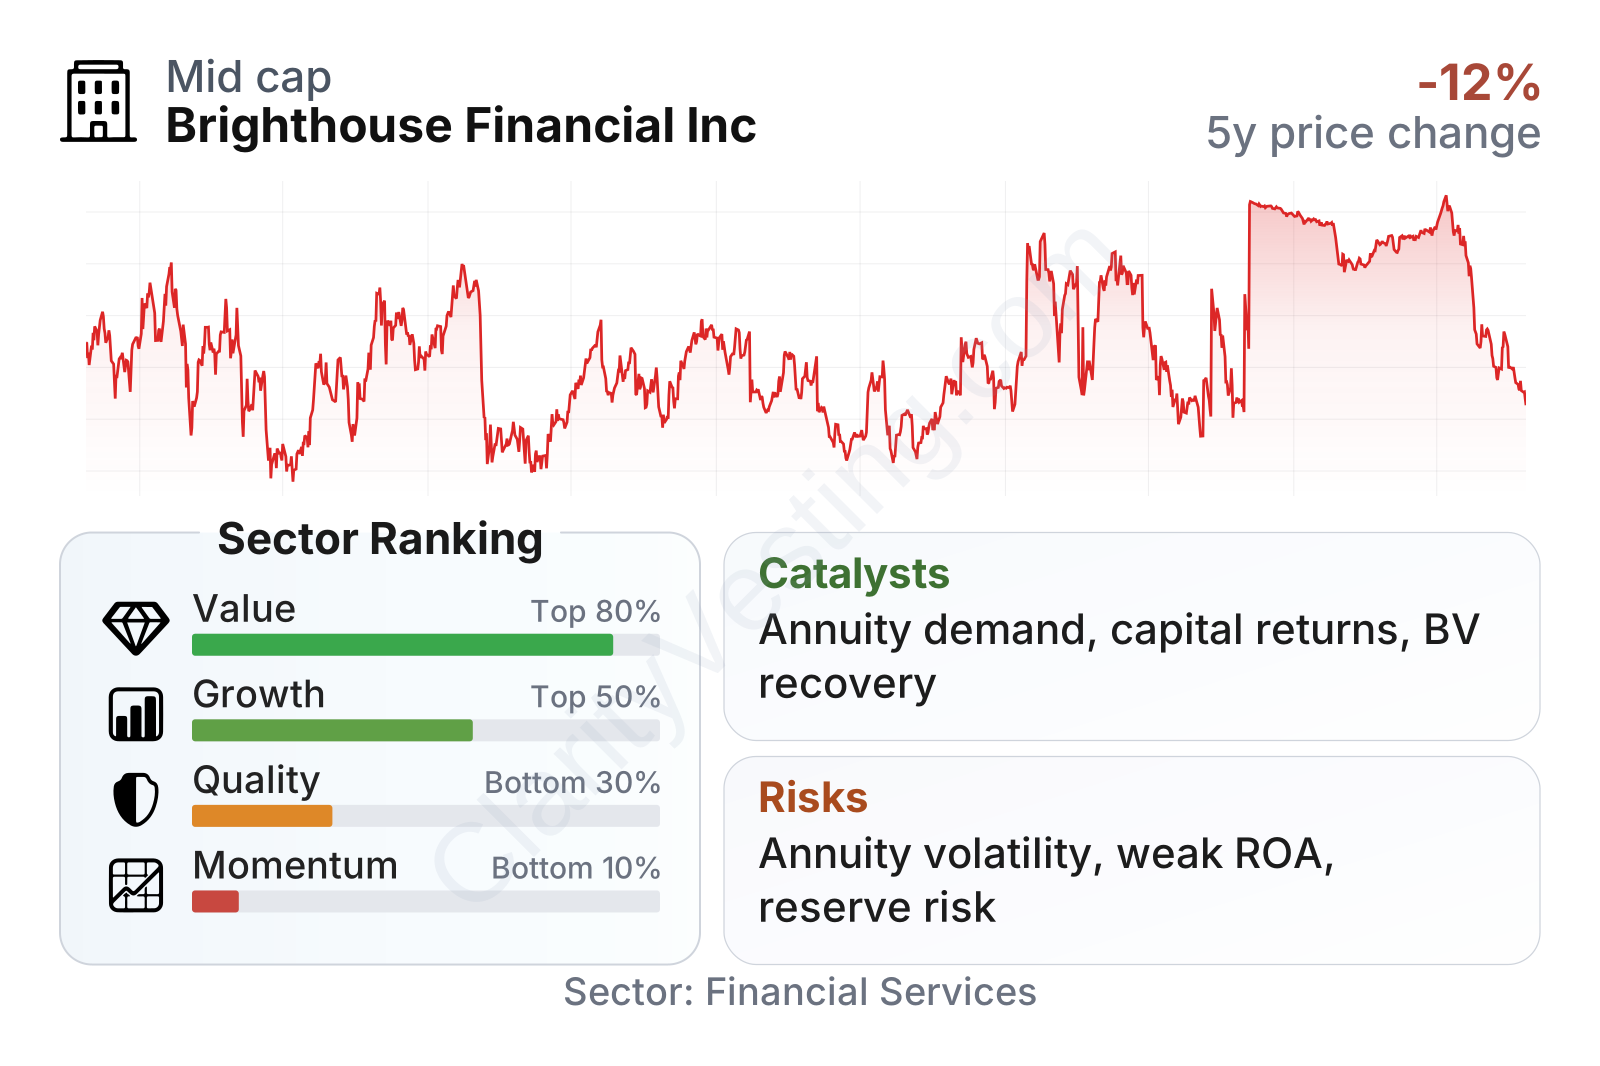
Brighthouse is a mid-sized life insurer by stock market value, and its shares have been volatile rather than steadily compounding. The stock moved in a wide range over the last few years and has recently climbed above earlier levels, but its momentum still ranks weakly versus much of the financial sector. In the factor snapshot, valuation stands out as the strongest area: the shares trade at a low earnings multiple and at well below book value compared with sector norms. Growth indicators are more mixed, while quality measures are weaker because returns on assets and long-term profitability have trailed many peers. The balance sheet metrics are more reassuring than the headline profitability numbers, with moderate debt-to-equity and net cash-type leverage measures that look better than sector medians.
Growth
Brighthouse operates in a sector with solid long-term demand drivers. Aging demographics in the United States, the shift from employer pensions to self-funded retirement, and the need for guaranteed lifetime income all support demand for annuities and retirement protection products. That does not make the industry fast-growing in the way technology markets can be, but it does create a durable need that should remain relevant for many years.
The company’s strategy is centered on products where risk can be priced and hedged more carefully, especially annuities tied to retirement income needs. That approach makes strategic sense because scale in annuities, asset-liability management, and risk controls can matter more than brand excitement. Brighthouse has also put emphasis on returning capital through share repurchases and dividends when regulators and capital conditions allow, which can materially affect per-share value for a company trading below book value.
Earnings per share have been positive but uneven. Rather than showing a clean upward line, the pattern points to a business whose reported profit depends heavily on market conditions, hedging outcomes, and accounting movements. That limits visibility, but it also means periods of weak headline results do not always reflect weakening product demand.
Book value per share has improved materially in the most recent period after a long stretch of pressure. For an insurer, that matters because book value is one of the clearest ways to judge whether capital is being rebuilt. A recovery here can support the case that the company has been stabilizing its balance sheet and preserving economic value even if accounting earnings remain noisy.
A meaningful catalyst is the continued expansion of retirement-income demand, especially for annuities with protected features. Another is the possibility that steadier interest rates and normalizing capital markets improve product economics and reduce earnings distortion. Company-hosted updates in 2026 also point to ongoing capital management and efforts to optimize the business mix, which could strengthen per-share results if sustained.
Risks
This article is for informational purposes only and does not constitute financial advice. Some content is AI-generated. See Disclaimer


