Stock Analysis · BGC Group Inc (BGC)
Overview
BGC Group Inc is a financial markets company that helps banks, broker-dealers, asset managers, energy firms, and other institutions trade a wide range of instruments. Its core business is interdealer brokerage and market infrastructure: it connects professional market participants, provides pricing and execution services, and increasingly uses electronic platforms to support trading in rates, foreign exchange, energy, commodities, credit, and equities. The company also owns a fast-growing futures exchange business through FMX, which is central to its long-term expansion plan.
BGC’s revenue is mainly generated from brokerage, trading-related fees, and technology-driven execution services across several asset classes. Based on recent company reporting, the broad mix can be summarized approximately as follows:
- Rates: about 35% to 40% of revenue. This includes interest rate products such as government bonds, repurchase agreements, and interest rate derivatives.
- Foreign exchange: about 15% to 20%. This covers spot and derivative FX markets used by institutions.
- Energy, commodities, and shipping: about 15% to 20%. These activities include brokerage in power, gas, oil-related products, environmental markets, and freight.
- Credit: about 10% to 15%. This segment includes corporate bonds and credit derivatives.
- Equities and equity derivatives: about 10% to 15%. This includes stock-related institutional brokerage activity.
- Data, software, and post-trade-related services: a smaller but strategically useful portion, generally in the single-digit percentage range, supporting market information and workflow services.
The business model is partly cyclical because trading volumes often increase when interest rates, volatility, or market uncertainty rise. That can make BGC more resilient than many ordinary financial firms during active market periods, although results can still move around from quarter to quarter.
Over the last several years, revenue has trended upward overall, and profitability improved meaningfully in 2024 and 2025 after a weaker 2023. One point worth noting is that margins remain modest for a capital markets firm because compensation, infrastructure, and financing costs absorb a large share of revenue.
The overall picture is one of expanding revenue with a recovery in operating profit and net income after a soft patch. It also shows that BGC remains a cost-heavy business, so sustained earnings growth depends not only on market activity but also on keeping expense growth under control while scaling newer platforms.
Key Figures
| Metric | Value | Sector ⓘ |
|---|---|---|
| Date | Oct 17, 2026 | |
| Context | ||
| Sector | Financial Services | |
| Industry | Capital Markets | |
| Market Cap ⓘ | $5.37B | |
| Beta ⓘ | 0.99 | |
Value (Cheapness) | ||
| P/E Ratio ⓘ | 28.77 | 12.26 |
| P/B Ratio ⓘ | 5.93 | 1.23 |
| FCF Yield ⓘ | 7.15% | 10.40% |
| Dividend Yield ⓘ | 0.69% | 3.02% |
| EBIT / EV ⓘ | 5.99% | 8.14% |
| PEG ⓘ | 3.60 | |
Growth (Business expansion) | ||
| Revenue Growth ⓘ | 8.30% | 9.35% |
| RPS Growth (5Y CAGR) ⓘ | 14.09% | 12.19% |
| EPS Growth (5Y CAGR) ⓘ | 2.22% | -9.53% |
| BVPS Growth (5Y CAGR) ⓘ | 9.71% | 4.99% |
| Margin Growth (5Y Trend) ⓘ | -1.06% | -3.86% |
| FCF Growth (5Y CAGR) ⓘ | -7.38% | 4.81% |
| DPS Growth (5Y CAGR) ⓘ | -10.18% | 8.79% |
Quality (Business durability) | ||
| ROIC (Latest) ⓘ | 9.75% | 9.49% |
| ROE (Latest) ⓘ | 23.04% | 13.90% |
| ROA (Latest) ⓘ | 3.44% | 1.55% |
| ROIC (5Y Median) ⓘ | 8.74% | 7.86% |
| ROE (5Y Median) ⓘ | 15.98% | 12.17% |
| ROA (5Y Median) ⓘ | 3.40% | 1.30% |
| Net Debt / EBIT (Latest) ⓘ | 2.44 | 0.96 |
| Net Debt / EBIT (5Y Median) ⓘ | 2.90 | 0.73 |
| Net Debt / EBITDA (Latest) ⓘ | 1.93 | 0.92 |
| Operating Margin (Latest) ⓘ | 12.03% | 22.30% |
| Operating Margin (5Y Median) ⓘ | 11.27% | 24.63% |
| Debt to Equity (Latest) ⓘ | 160.47% | 58.56% |
| Profit Margin (Latest) ⓘ | 6.29% | 26.57% |
| Free Cash Flow (Latest) ⓘ | $383.81M | |
Momentum (Price trend) | ||
| 3Y Return ⓘ | +101.65% | +88.33% |
| 12M Return (excl. last month) ⓘ | +24.25% | +19.38% |
| 6M Return ⓘ | -0.23% | +4.75% |
| Price vs. 200-Day MA ⓘ | +8.65% | +3.50% |
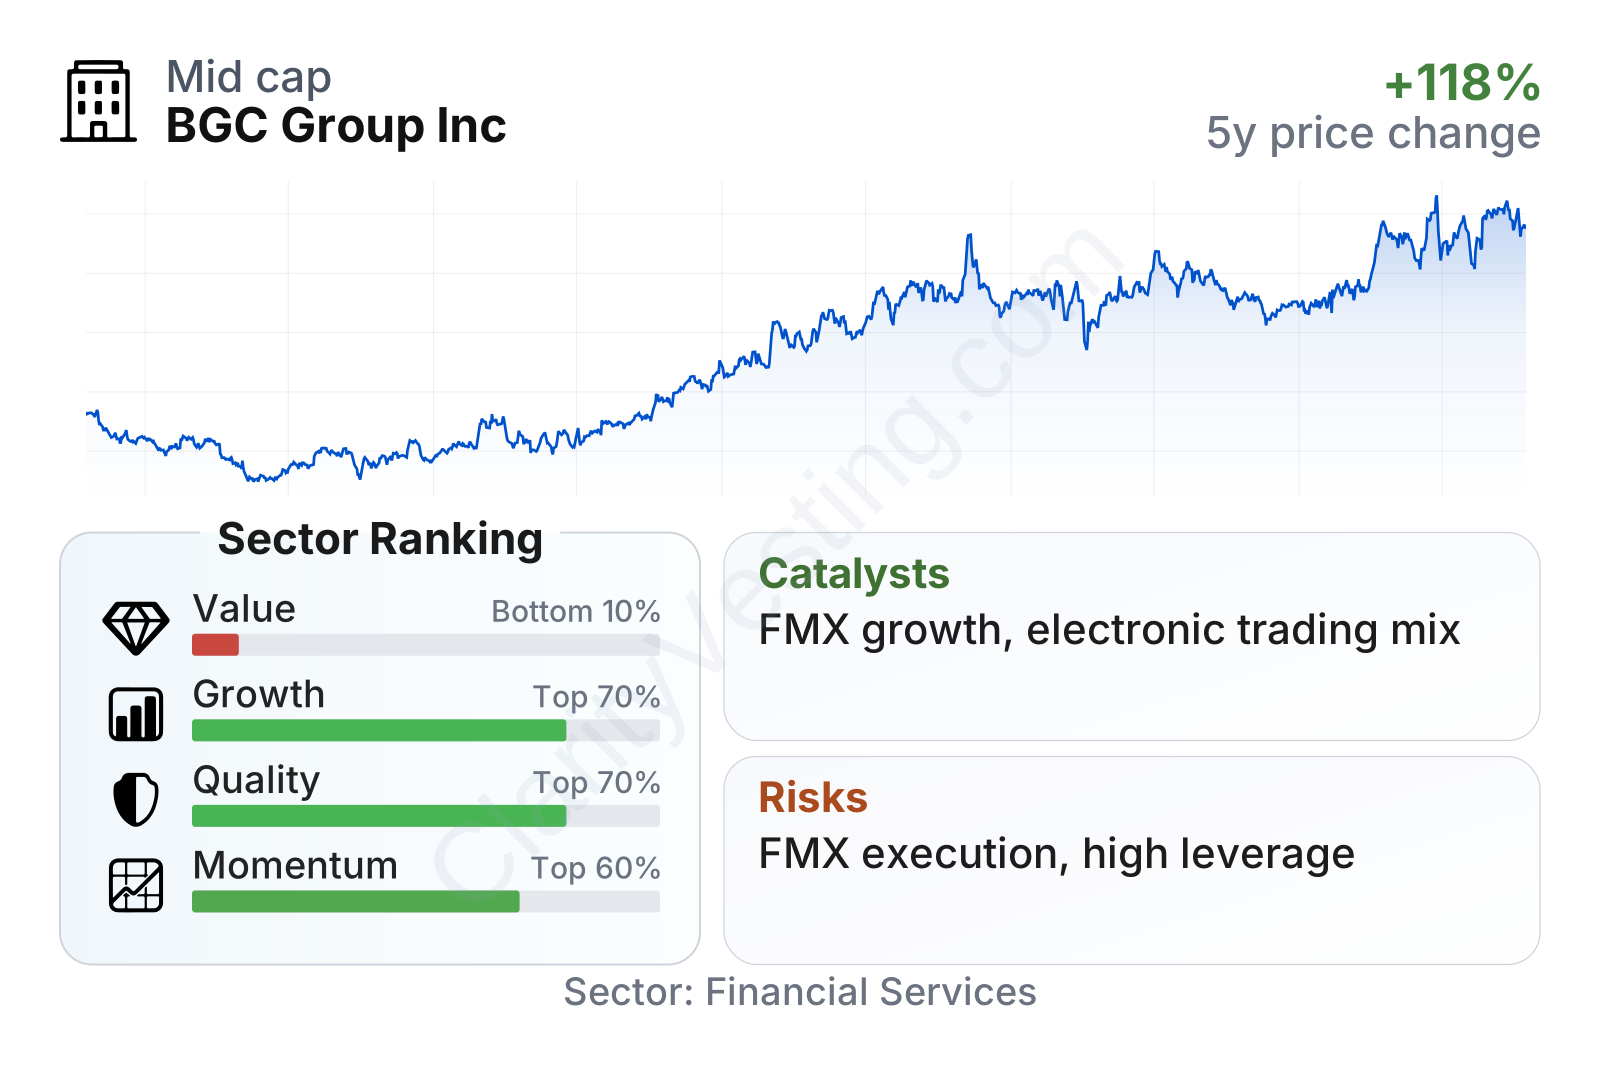
BGC is a mid-sized capital markets company with a stock that has risen strongly from 2022 lows and has outperformed the sector median over the last three years. The table shows a mixed profile: growth and returns on capital are better than many peers, but valuation multiples are clearly richer than the sector, while leverage is also higher. That combination suggests the market is already recognizing the company’s recent progress and future exchange-related ambitions.
On profitability, return on equity and return on assets are both above sector medians, which indicates that recent earnings are being generated more efficiently than at many comparable firms. On the other hand, free cash flow growth and dividend growth over five years are weak, reminding readers that BGC is still in a transition phase rather than operating as a mature cash-return story.
Growth
BGC operates in a part of finance that is structurally relevant for the long term. Institutional trading does not depend on consumer demand; it depends on the need for liquidity, hedging, risk transfer, and price discovery. As markets become more electronic and regulation favors transparency and central clearing in more products, scale platforms can become more valuable. That is especially important for BGC because its strategy is not just to broker trades, but to own more of the market infrastructure around them.
The company’s most important growth catalyst is FMX, its U.S. futures exchange initiative. BGC is trying to build a stronger position in listed rates and related clearing activity, areas that are much larger and more entrenched than traditional voice brokerage. If FMX continues to gain traction, the earnings potential could be significant because exchange businesses usually have stronger network effects and better incremental margins than brokered transactions. This is the clearest reason the market has been willing to assign BGC a valuation well above many sector peers.
Another positive point is that BGC has shown a solid medium-term expansion in revenue per share and book value per share, both ahead of the sector median over five years. That suggests the company has created economic value despite uneven annual results.
The earnings trend has been improving, with annual EPS moving higher from 2021 through 2025. Even allowing for some variation in interim periods, the broader direction supports the idea that the core brokerage franchise plus newer exchange efforts are producing a stronger profit base than a few years ago.
Book value per share has not moved in a straight line, but the broader trend remains upward over five years. For a financial business, that matters because it shows that the company has still been building shareholder equity over time, even while investing in expansion initiatives.
Recent company communications have continued to emphasize electronic growth, futures market development, and deeper participation from major market-making and institutional clients. If BGC keeps adding volume and liquidity to FMX while preserving momentum in rates and energy brokerage, its growth profile could continue to improve relative to more mature capital markets peers.
Risks
This article is for informational purposes only and does not constitute financial advice. Some content is AI-generated. See Disclaimer


