Stock Analysis · Beach Energy Ltd (BEPTF)
Overview
Beach Energy Ltd is an Australian oil and gas producer focused on exploring for, developing, and producing hydrocarbons. Its assets are concentrated in Australia and New Zealand, with core positions in the Cooper Basin, the Otway Basin, the Bass Basin, and the Perth Basin. In simple terms, the company finds and develops energy fields, sells the gas, crude oil, condensate, and natural gas liquids it produces, and also benefits from infrastructure and joint venture arrangements tied to those fields.
For long-term readers, the most important point is that Beach Energy is primarily a gas-weighted upstream energy company. That matters because gas demand in Australia is supported by power generation needs, industrial use, and structural supply tightness on the east coast. At the same time, the company remains exposed to oil-linked pricing and to the normal swings of the commodity cycle.
Based on the company’s recent annual reporting, revenue is mainly generated from product sales rather than from diversified service lines. The mix can shift from year to year with prices and production volumes, but the business is broadly organized as follows:
- Natural gas sales: approximately 60% to 70% of revenue. This is the company’s largest earnings base and includes domestic gas supplied under contract to Australian customers.
- Crude oil and condensate sales: approximately 20% to 30% of revenue. These liquids are more sensitive to global oil prices and can have an outsized effect on profit when prices move sharply.
- LPG and other hydrocarbons: approximately 5% to 10% of revenue. This includes by-products associated with gas production.
- Other operating revenue: a small residual share, typically including transport, processing, and miscellaneous field-related income where applicable.
The earnings pattern has been uneven in recent years. Revenue has stayed at a meaningful level, but profitability has been more volatile because of impairments, pricing shifts, and production mix changes. Even so, the business remains sizable for a regional producer, with a market value around the lower end of the mid-cap range in public markets.
The operating flow has been notably volatile. Revenue rose strongly into fiscal 2025 and then eased in fiscal 2026, while profit swung from strong earnings in earlier years to losses during the impairment-heavy period and then back to positive net income. That pattern highlights how much reported results can change in this industry even when production assets remain in place.
Key Figures
| Metric | Value | Sector ⓘ |
|---|---|---|
| Date | Oct 31, 2026 | |
| Context | ||
| Sector | Energy | |
| Industry | Oil & Gas E&P | |
| Market Cap ⓘ | $1.49B | |
| Beta ⓘ | 0.13 | |
Value (Cheapness) | ||
| P/E Ratio ⓘ | 8.16 | 15.08 |
| P/B Ratio ⓘ | 0.46 | 1.73 |
| FCF Yield ⓘ | 49.25% | 8.21% |
| Dividend Yield ⓘ | 4.59% | 3.46% |
| EBIT / EV ⓘ | N/A | 7.46% |
| PEG ⓘ | N/A | |
Growth (Business expansion) | ||
| Revenue Growth ⓘ | -17.10% | 26.85% |
| RPS Growth (5Y CAGR) ⓘ | 2.32% | 6.98% |
| EPS Growth (5Y CAGR) ⓘ | -10.41% | -13.45% |
| BVPS Growth (5Y CAGR) ⓘ | -1.98% | 6.27% |
| Margin Growth (5Y Trend) ⓘ | -21.06% | 0.61% |
| FCF Growth (5Y CAGR) ⓘ | 3.10% | 3.35% |
| DPS Growth (5Y CAGR) ⓘ | 36.71% | 16.79% |
Quality (Business durability) | ||
| ROIC (Latest) ⓘ | N/A | 11.53% |
| ROA (Latest) ⓘ | 4.26% | 6.01% |
| ROIC (5Y Median) ⓘ | 9.00% | 10.35% |
| ROA (5Y Median) ⓘ | 5.26% | 5.46% |
| Net Debt / EBIT (Latest) ⓘ | 1.21 | 1.61 |
| Net Debt / EBIT (5Y Median) ⓘ | 0.32 | 1.82 |
| Net Debt / EBITDA (Latest) ⓘ | 0.33 | 1.03 |
| Net Debt / Assets ⓘ | 7.75% | 16.57% |
| EBITDA / Interest ⓘ | N/A | 9.67 |
| Operating Margin (Latest) ⓘ | 8.61% | 15.60% |
| Operating Margin (5Y Median) ⓘ | 20.60% | 20.44% |
| Debt to Equity (Latest) ⓘ | 19.31% | 51.18% |
| Profit Margin (Latest) ⓘ | 14.65% | 8.82% |
| Free Cash Flow (Latest) ⓘ | $733.66M | |
Momentum (Price trend) | ||
| 3Y Return ⓘ | -6.55% | +73.65% |
| 12M Return (excl. last month) ⓘ | -16.70% | +36.08% |
| 6M Return ⓘ | -22.25% | +6.58% |
| Price vs. 200-Day MA ⓘ | -5.00% | +11.74% |
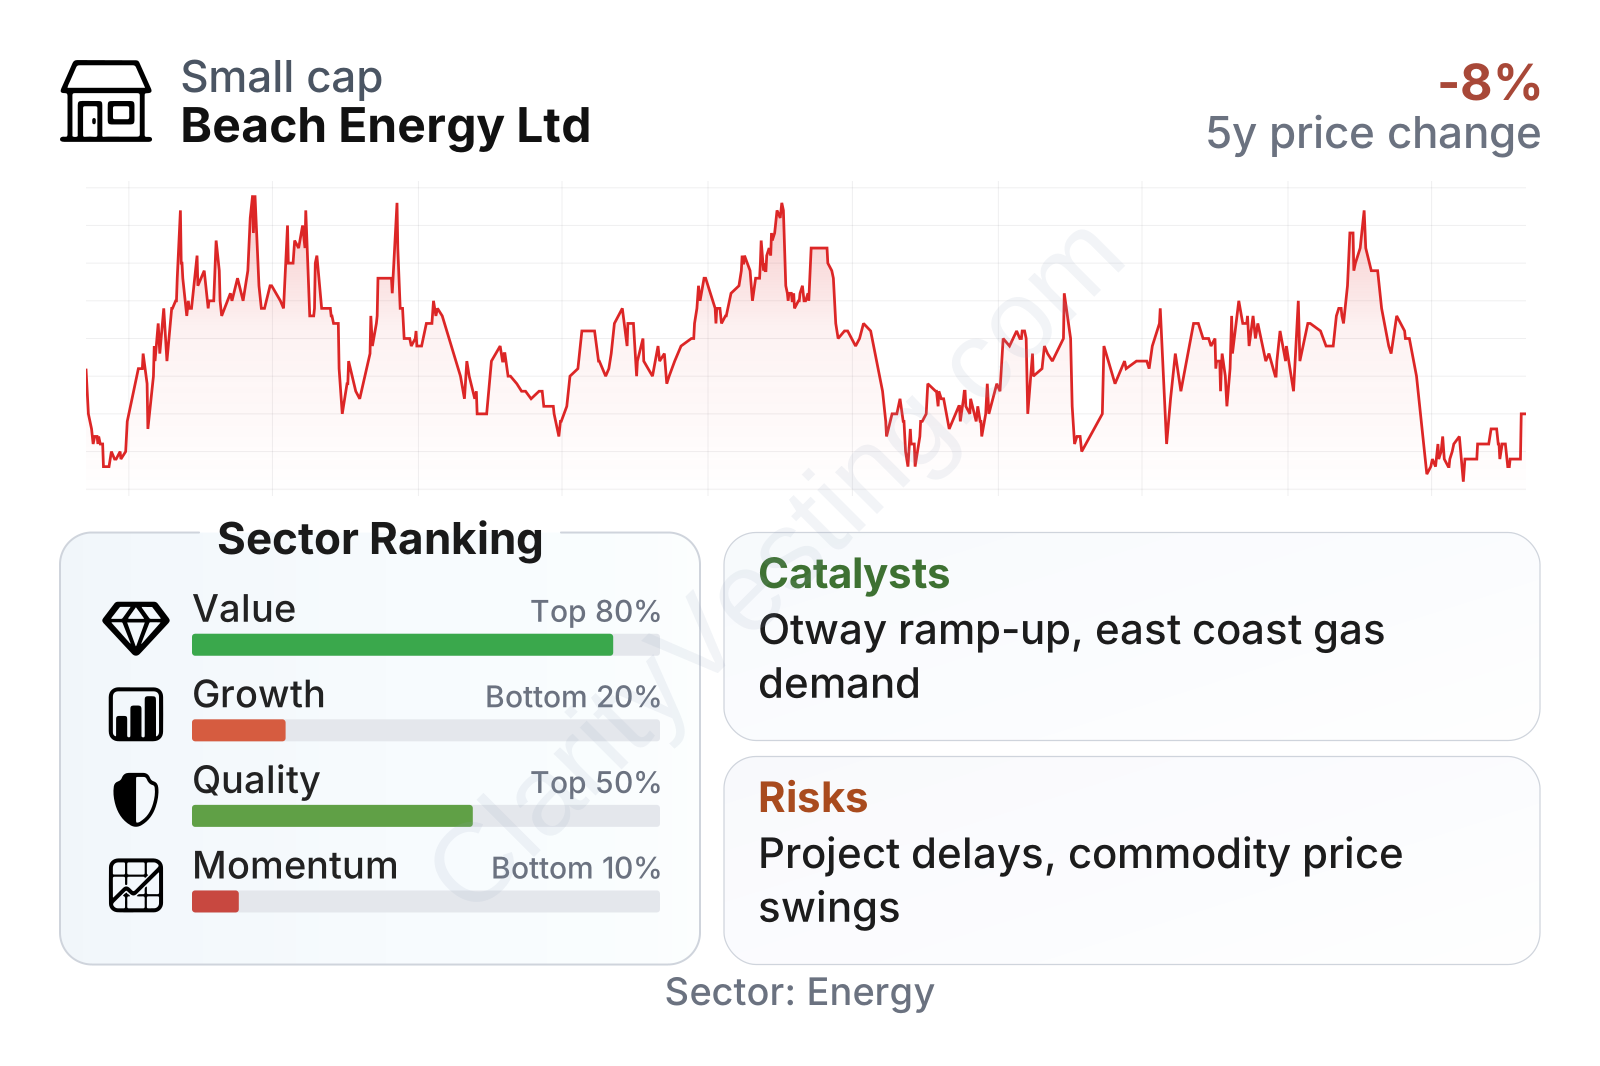
The overall picture is mixed. On valuation, Beach Energy screens cheaper than much of its sector, with lower earnings and book multiples and a notably strong free cash flow yield. On quality, the balance sheet looks relatively conservative for an upstream producer, especially on debt measures. The weak area is growth: recent revenue and margin trends have lagged the broader energy group, and the stock’s recent market performance has also trailed peers.
The share price history also shows a business that has not enjoyed a sustained re-rating. Over the last several years, the stock has moved within a fairly narrow range and has recently drifted lower, which suggests the market is waiting for clearer evidence of durable production growth and steadier profitability.
Growth
Beach Energy operates in a sector that still has a long runway in Australia, particularly for natural gas. Gas remains important for electricity reliability, industrial demand, and as a transition fuel where coal supply is being displaced. That does not make the sector immune from volatility, but it does mean the company is not operating in a market with collapsing underlying demand.
The company’s strategy is centered on lifting output from existing basins, bringing development projects online, and using its infrastructure-linked positions to convert reserves into cash flow more efficiently. That approach is logical for a producer of Beach Energy’s size because it relies less on transformational acquisitions and more on extracting value from assets it already knows well. The practical test is execution: production growth only matters if projects arrive on time, within budget, and at margins that hold up after hedging and operating costs.
A meaningful catalyst has been the ramp-up and optimization of its key Australian gas projects, especially in the Otway region, where new wells and development phases have the potential to support volumes and domestic gas sales. Management has also been focused on improving reliability and reducing the disruption that weighed on prior periods. If that translates into steadier production, the company’s low valuation profile could become easier for the market to recognize.
Another useful sign is cash generation. Despite uneven accounting earnings over the last few years, free cash flow has improved materially in the most recent periods. That gives the company more flexibility to fund development, manage debt, and maintain shareholder distributions without relying heavily on external capital.
Recent cash flow momentum has been encouraging, with free cash flow rising from the low hundreds of millions to a meaningfully higher level over the following period. For a commodity producer, that is important because internally generated cash is often the clearest sign that operations are supporting the investment program.
Recent company updates have also emphasized production guidance, drilling progress, and the role of east coast gas supply. In the current market, any sign that Beach Energy can consistently deliver domestic gas into a tighter Australian supply backdrop is a potential medium-term opportunity.
Risks
This article is for informational purposes only and does not constitute financial advice. Some content is AI-generated. See Disclaimer


