Stock Analysis · Brookfield Renewable Corp (BEPC)
Overview
Brookfield Renewable Corp is one of the publicly traded vehicles linked to Brookfield’s global renewable power platform. In simple terms, it owns and operates assets that produce electricity from renewable sources and sells that electricity under long-term contracts. The business is built around generating cash from power plants, recycling capital into new projects, and expanding through development and acquisitions.
The company’s asset base is diversified across several technologies and regions. Brookfield Renewable’s broader platform includes hydroelectric, wind, solar, distributed generation, and storage assets, with operations across North America, South America, Europe, and Asia-Pacific. That mix matters because it reduces reliance on one single power source, one weather pattern, or one electricity market.
Its revenue mainly comes from selling power and related services. Based on the company’s reporting structure and public disclosures from the Brookfield Renewable platform, the business is primarily driven by:
- Hydroelectric generation: approximately 40% to 45% of generation capacity. These are long-life dams and water-powered facilities that usually provide stable output and can be difficult to replicate.
- Wind power: approximately 25% to 30% of capacity. This includes onshore wind farms selling electricity through utilities, corporate contracts, and wholesale markets.
- Solar power: approximately 20% to 25% of capacity. This segment includes utility-scale solar projects and growing development pipelines.
- Distributed generation, storage, and other sustainable solutions: approximately 5% to 10% of capacity. These activities can include smaller local energy systems, battery storage, and other contracted clean-energy solutions.
From a business-model perspective, Brookfield Renewable is less like a fast-changing technology company and more like an infrastructure owner. It builds or acquires projects, signs long-duration contracts, collects power revenue, and uses financing and asset sales to fund further expansion. That structure can create relatively visible cash generation, although reported earnings can still swing because of financing costs, asset revaluations, and one-time items.
Over the last several years, revenue moved from about $3.4 billion in 2021 to just above $4.1 billion in 2024 before falling back toward roughly $3.7 billion in 2025. The more notable change was profitability: interest expense rose sharply over that period, and the company moved from solid net income in earlier years to a sizable loss in 2025. That contrast is important for long-term analysis because it shows that the assets can generate meaningful gross profit, but financing structure has become a major factor in shareholder results.
The business still shows strong gross profit relative to revenue, but the pressure from interest costs has become much heavier. In recent years, the gap between operating performance and net income widened, which helps explain why the underlying asset base can look attractive while headline earnings remain volatile.
Key Figures
| Metric | Value | Sector ⓘ |
|---|---|---|
| Date | Oct 17, 2026 | |
| Context | ||
| Sector | Utilities | |
| Industry | Utilities - Renewable | |
| Market Cap ⓘ | $5.37B | |
| Beta ⓘ | 1.15 | |
Value (Cheapness) | ||
| P/E Ratio ⓘ | N/A | 17.28 |
| P/B Ratio ⓘ | N/A | 1.51 |
| FCF Yield ⓘ | -10.32% | 0.65% |
| Dividend Yield ⓘ | 5.42% | 3.77% |
| EBIT / EV ⓘ | -14.68% | 5.01% |
| PEG ⓘ | 2.30 | |
Growth (Business expansion) | ||
| Revenue Growth ⓘ | 13.00% | 6.10% |
| RPS Growth (5Y CAGR) ⓘ | 1.05% | 3.87% |
| EPS Growth (5Y CAGR) ⓘ | N/A | -11.30% |
| BVPS Growth (5Y CAGR) ⓘ | N/A | 4.23% |
| Margin Growth (5Y Trend) ⓘ | -46.13% | 3.57% |
| FCF Growth (5Y CAGR) ⓘ | -9.86% | -8.84% |
| DPS Growth (5Y CAGR) ⓘ | -50.21% | 4.84% |
Quality (Business durability) | ||
| ROIC (Latest) ⓘ | -17.18% | 6.53% |
| ROA (Latest) ⓘ | -9.85% | 3.20% |
| ROIC (5Y Median) ⓘ | 6.38% | 5.95% |
| ROA (5Y Median) ⓘ | 0.50% | 2.75% |
| Net Debt / EBIT (Latest) ⓘ | N/A | 7.13 |
| Net Debt / EBIT (5Y Median) ⓘ | 7.94 | 7.23 |
| Net Debt / EBITDA (Latest) ⓘ | N/A | 4.31 |
| Net Debt / Assets ⓘ | 30.27% | 38.42% |
| EBITDA / Interest ⓘ | N/A | 4.58 |
| Operating Margin (Latest) ⓘ | -71.26% | 20.83% |
| Operating Margin (5Y Median) ⓘ | 41.32% | 20.08% |
| Debt to Equity (Latest) ⓘ | -464.91% | 137.69% |
| Profit Margin (Latest) ⓘ | -102.27% | 11.37% |
| Free Cash Flow (Latest) ⓘ | -$554.03M | |
Momentum (Price trend) | ||
| 3Y Return ⓘ | +41.39% | +52.37% |
| 12M Return (excl. last month) ⓘ | -8.90% | +8.84% |
| 6M Return ⓘ | -32.31% | -3.95% |
| Price vs. 200-Day MA ⓘ | -22.34% | -0.79% |
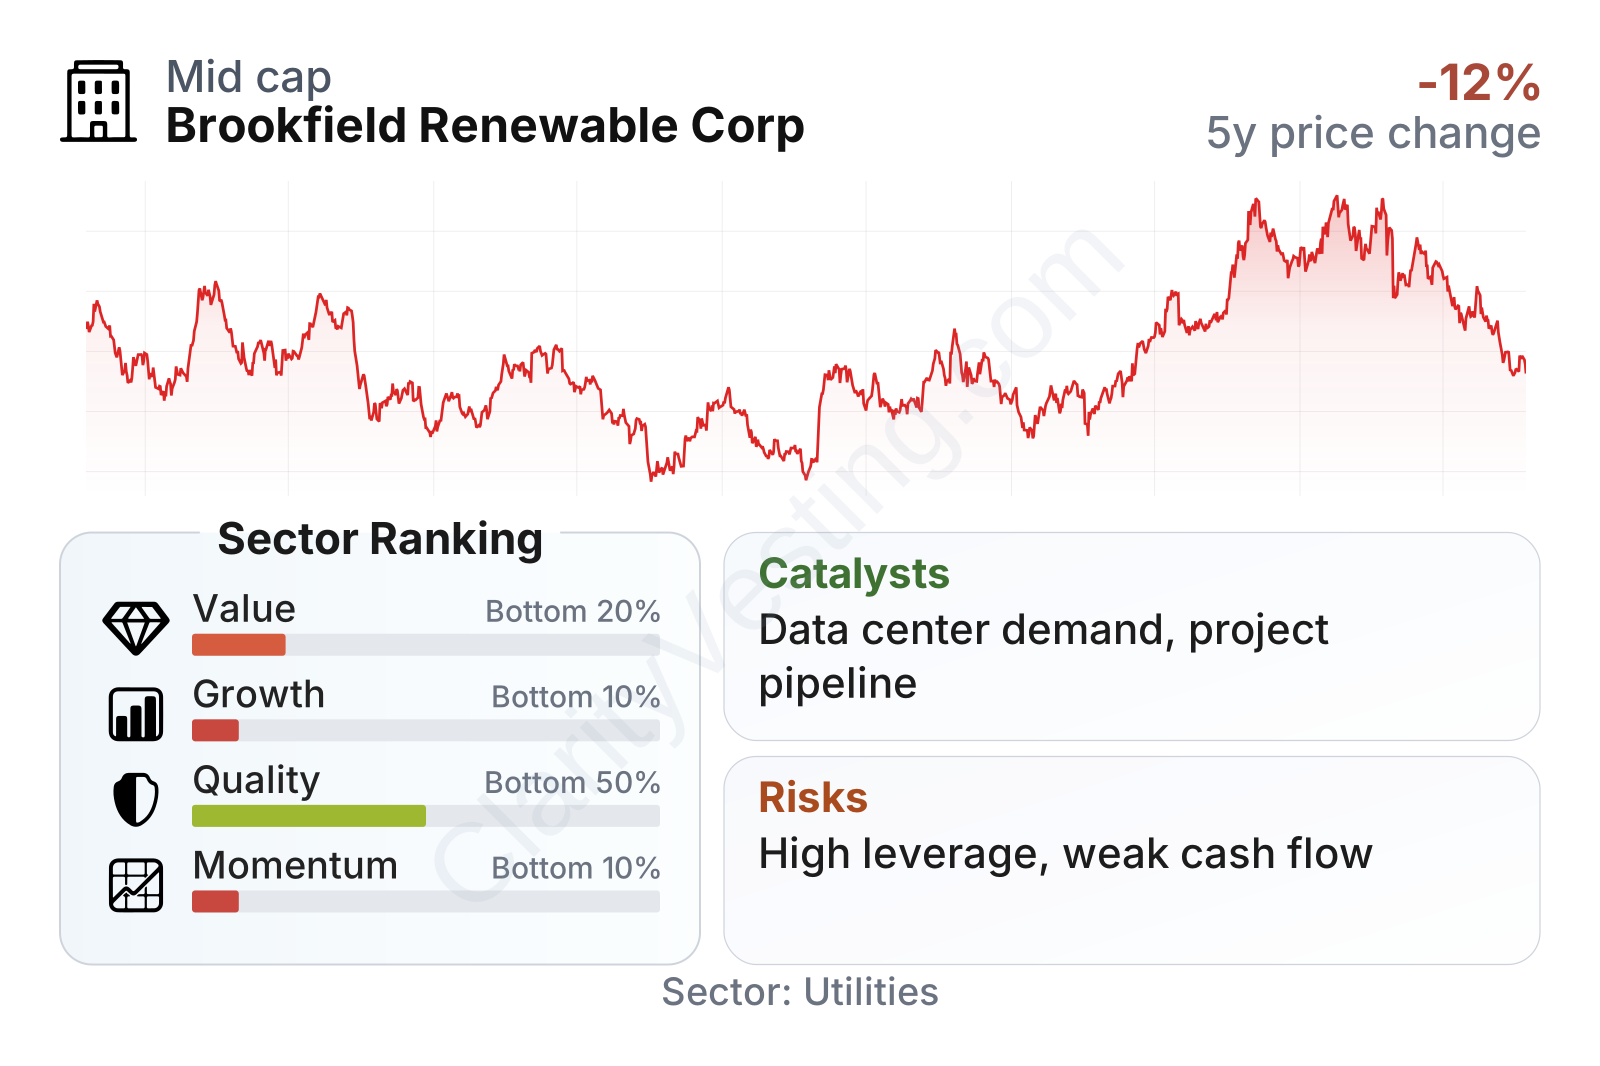
Brookfield Renewable sits in the lower end of the sector on value, growth, and momentum measures, while quality is closer to the middle but still not a standout. The stock offers a dividend yield above the sector median, yet that income profile is offset by negative free cash flow, weak recent profitability, and softer share-price performance than many renewable utility peers. The company is mid-sized rather than one of the sector’s giants, and its share-price swings have been somewhat higher than the market average.
The stock chart shows a volatile path rather than a steady upward trend. After trading in the low-$30s in late 2021, the shares went through a deep drawdown, then recovered strongly into 2026 before pulling back again. That pattern fits the company’s rate-sensitive profile: when financing conditions or sentiment toward renewables worsen, the stock can react sharply.
Growth
Brookfield Renewable operates in a sector with a long runway. Electricity demand is rising, many countries continue to expand clean-energy targets, and large corporations increasingly want long-term renewable power contracts. Those forces support demand for new hydro, wind, solar, storage, and grid-connected clean-energy infrastructure. In that sense, the company is clearly positioned in a structurally growing market.
Its strategy also makes sense on paper. Brookfield Renewable combines operating assets that generate current cash flow with a large development pipeline that can support future expansion. It also benefits from the broader Brookfield ecosystem, which gives it access to deal flow, institutional relationships, operating expertise, and a history of buying assets at scale. For a capital-intensive business, those advantages can matter as much as the technology itself.
A key growth catalyst is corporate power demand. Data centers, industrial electrification, and grid decarbonization are creating demand for reliable clean electricity in many markets. Companies with large project pipelines and existing operating relationships are in a better position to capture that demand than smaller independent developers with limited balance-sheet flexibility.
Revenue per share has been uneven rather than consistently compounding. There was a strong jump in 2024, followed by a decline in 2025, which suggests that growth has depended not only on asset expansion but also on timing, market conditions, and capital allocation. That does not cancel the long-term opportunity, but it does show that the path is not smooth.
Free cash flow has also been volatile and recently negative again. That is not unusual for renewable infrastructure groups that are actively building and acquiring assets, but it does mean growth is currently consuming capital rather than clearly producing surplus cash. For a long-term owner, this makes project execution and financing discipline especially important.
Recent company updates and filings in 2026 continue to point toward development, commissioning activity, and portfolio recycling as the main opportunity set. The broader opening for Brookfield Renewable is not based on a single breakthrough product; it comes from being a scaled owner-operator in a market where the world needs more low-carbon electricity over many years.
Risks
This article is for informational purposes only and does not constitute financial advice. Some content is AI-generated. See Disclaimer


