Stock Analysis · Franklin Resources Inc (BEN)
Overview
Franklin Resources, better known through the Franklin Templeton brand, is a global asset manager. In simple terms, it manages money on behalf of clients such as individuals, financial advisors, retirement plans, institutions, insurers, and sovereign entities. The company offers mutual funds, exchange-traded funds, separate accounts, wealth management, alternatives, and specialized investment strategies across equities, fixed income, multi-asset, and private markets.
Its business model is largely based on charging fees on assets under management. When client assets rise because markets go up or because new money comes in, revenue can improve. When markets fall or clients withdraw money, revenue usually comes under pressure. That makes Franklin Resources highly tied to both investment performance and investor confidence.
Based on the latest annual filing, the company’s revenue mix is centered on investment management fees, with smaller contributions from administration, distribution, shareholder servicing, performance fees, and other sources. Approximate revenue sources are:
- Investment management fees: about 76% to 80% — recurring fees earned for managing client assets across funds, advisory accounts, retirement assets, and institutional mandates.
- Sales and distribution fees: about 8% to 10% — includes distribution-related compensation tied to selling and supporting investment products.
- Shareholder servicing and administration fees: about 7% to 9% — covers transfer agency, fund administration, servicing, and operational support.
- Performance fees and other: about 3% to 6% — includes incentive-based fees, investment and financing income, and other miscellaneous revenue lines.
Franklin Resources has also been reshaping itself through acquisitions, especially in alternatives and specialized capabilities. The purchase of Legg Mason materially expanded the firm’s scale and broadened its investment lineup, while more recent efforts have pushed deeper into private credit, real estate, secondary private equity, and digital distribution. This matters because traditional active asset management has faced fee pressure for years, while alternatives and outcome-oriented products generally offer stickier assets and stronger fee rates.
The company is large enough to compete globally, but it is not the clear industry leader. It sits in a crowded market where scale, brand, long-term performance, product breadth, and distribution relationships all matter.
The long-term picture shows that revenue has held up better than earnings. Sales have recovered from the 2023 dip and are now above prior levels, but operating income and net income remain much lower than a few years ago. That gap suggests cost growth, integration expenses, and margin pressure have been important issues.
Key Figures
| Metric | Value | Sector ⓘ |
|---|---|---|
| Date | Oct 17, 2026 | |
| Context | ||
| Sector | Financial Services | |
| Industry | Asset Management | |
| Market Cap ⓘ | $15.51B | |
| Beta ⓘ | 1.58 | |
Value (Cheapness) | ||
| P/E Ratio ⓘ | 21.20 | 12.26 |
| P/B Ratio ⓘ | 1.78 | 1.23 |
| FCF Yield ⓘ | 1.44% | 10.40% |
| Dividend Yield ⓘ | 4.20% | 3.02% |
| EBIT / EV ⓘ | 4.74% | 8.14% |
| PEG ⓘ | 0.41 | |
Growth (Business expansion) | ||
| Revenue Growth ⓘ | 14.30% | 9.35% |
| RPS Growth (5Y CAGR) ⓘ | -0.23% | 12.19% |
| EPS Growth (5Y CAGR) ⓘ | -12.54% | -9.53% |
| BVPS Growth (5Y CAGR) ⓘ | -2.82% | 4.99% |
| Margin Growth (5Y Trend) ⓘ | -19.97% | -3.86% |
| FCF Growth (5Y CAGR) ⓘ | -5.97% | 4.81% |
| DPS Growth (5Y CAGR) ⓘ | 3.84% | 8.79% |
Quality (Business durability) | ||
| ROIC (Latest) ⓘ | 3.88% | 9.49% |
| ROE (Latest) ⓘ | 9.08% | 13.90% |
| ROA (Latest) ⓘ | 2.60% | 1.55% |
| ROIC (5Y Median) ⓘ | 5.15% | 7.86% |
| ROE (5Y Median) ⓘ | 8.08% | 12.17% |
| ROA (5Y Median) ⓘ | 3.03% | 1.30% |
| Net Debt / EBIT (Latest) ⓘ | 9.24 | 0.96 |
| Net Debt / EBIT (5Y Median) ⓘ | 5.03 | 0.73 |
| Net Debt / EBITDA (Latest) ⓘ | 7.41 | 0.92 |
| Operating Margin (Latest) ⓘ | 15.02% | 22.30% |
| Operating Margin (5Y Median) ⓘ | 18.62% | 24.63% |
| Debt to Equity (Latest) ⓘ | 142.36% | 58.56% |
| Profit Margin (Latest) ⓘ | 8.72% | 26.57% |
| Free Cash Flow (Latest) ⓘ | $223.30M | |
Momentum (Price trend) | ||
| 3Y Return ⓘ | +60.30% | +88.33% |
| 12M Return (excl. last month) ⓘ | +43.94% | +19.38% |
| 6M Return ⓘ | +20.23% | +4.75% |
| Price vs. 200-Day MA ⓘ | +7.03% | +3.50% |
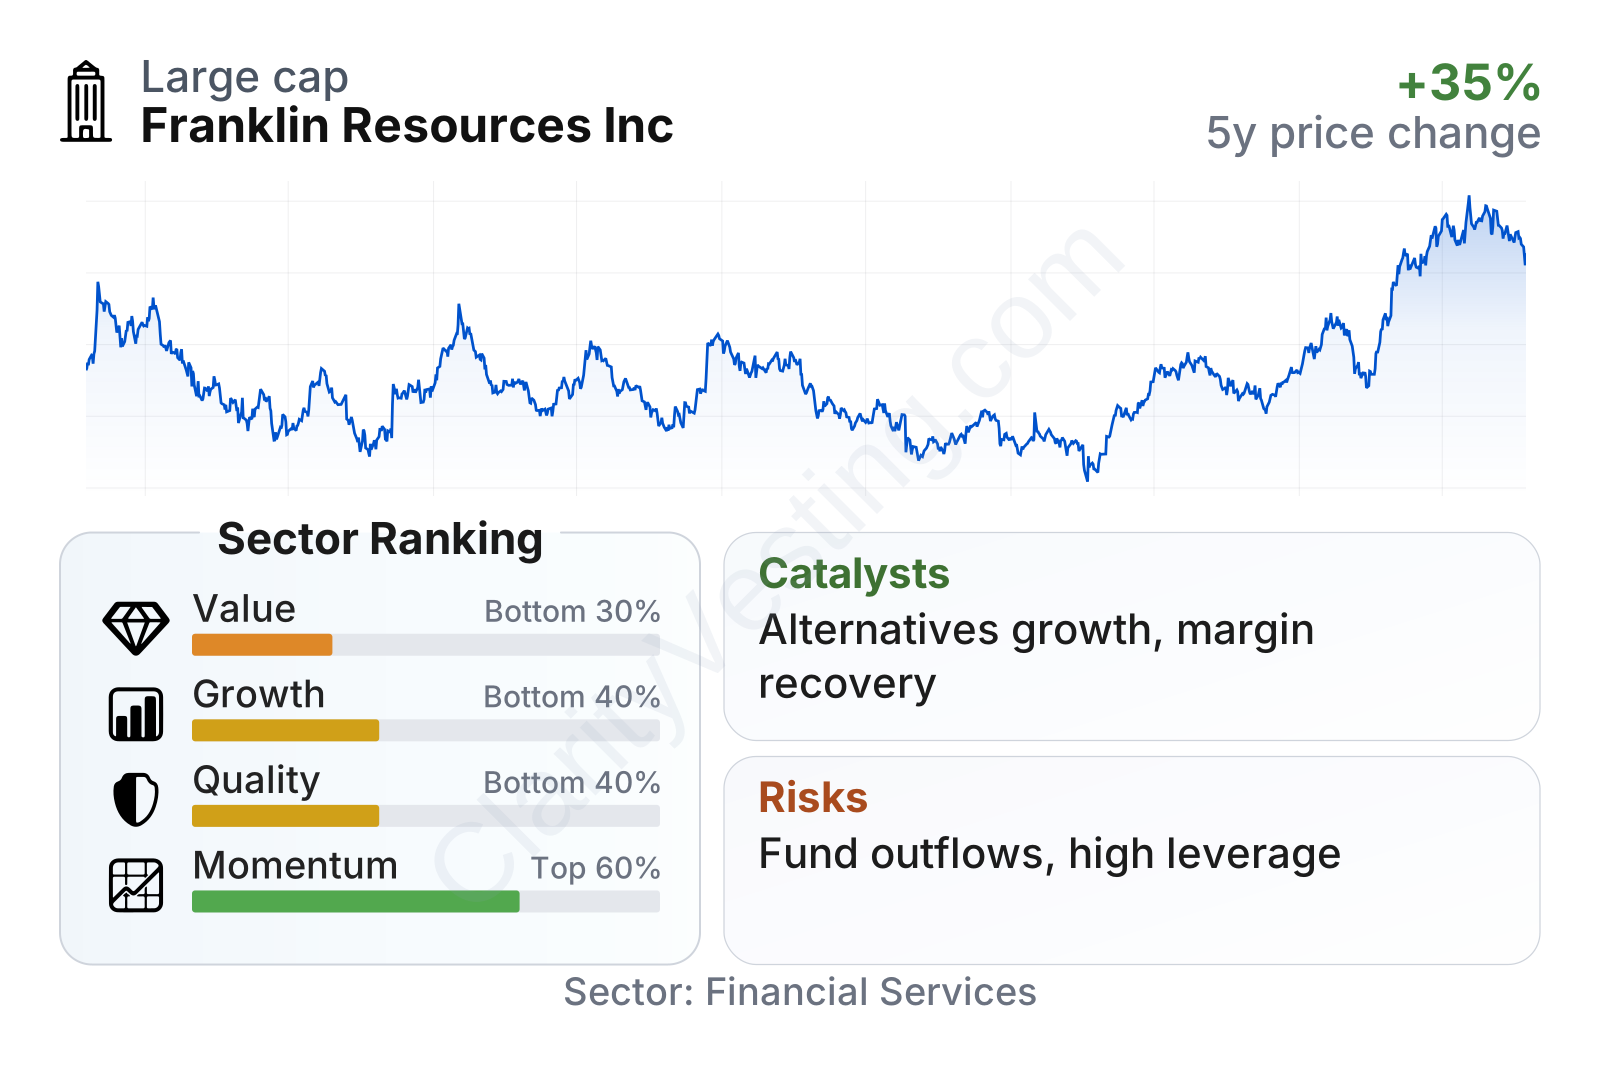
Franklin Resources stands out as a mid-to-large-sized listed asset manager with a relatively high share-price volatility, reflected in a beta above 1.5. The factor profile is mixed: recent price momentum has been strong, but value, growth, and quality rank below much of the sector. Revenue growth has recently improved, yet profitability, cash generation, and returns on capital are still weaker than many peers. The dividend yield remains above the sector median, but the stock also trades at higher earnings and book multiples than its own recent history and above sector medians.
The share price recovery since 2025 has been sharp. That rebound shows improving market confidence, but it also means the market has already recognized at least part of the recent operational stabilization.
Growth
Franklin Resources operates in a sector with both mature and growing segments. Traditional actively managed mutual funds are not a high-growth area by themselves, especially as low-cost passive products continue taking share. However, the broader wealth and asset management industry still benefits from structural tailwinds: aging populations needing retirement solutions, rising global financial savings, increased use of outsourced investment management, and expanding demand for private markets, ETFs, and multi-asset solutions.
For Franklin, the strategy for future growth is reasonably clear. Management has been diversifying away from a heavy reliance on traditional long-only active funds and building a broader platform across fixed income, wealth channels, ETFs, and alternatives. That strategy makes industrial sense because it reduces dependence on any one product category and targets areas where fees are often better defended.
Another potential catalyst is operating leverage. Asset managers do not need revenue to rise dramatically for earnings to improve; if markets stay constructive and assets under management rise, a meaningful part of added fee revenue can flow through to profit once the cost base is under control. That is particularly relevant here because recent years have shown revenue resilience but compressed margins.
Earnings per share have trended downward over several years, which shows that Franklin has not yet turned higher revenue into stronger bottom-line performance. For the growth case to become more convincing, the next step is not just asset growth but sustained earnings recovery.
Book value per share has also drifted lower over time. That is not automatically alarming for an asset manager, but it does show that balance-sheet growth has not been a recent strength. A more durable improvement would ideally come from stronger retained earnings, steadier margins, and successful scaling of acquired businesses.
Recent company updates have emphasized continued product expansion in alternatives, ETFs, and customized solutions, as well as partnerships that broaden distribution. In a business where scale and product breadth help win mandates, these moves can create opportunity if Franklin can convert them into net inflows rather than just maintain existing client assets.
Risks
This article is for informational purposes only and does not constitute financial advice. Some content is AI-generated. See Disclaimer


