Stock Analysis · Beach Energy Ltd (BCHEY)
Overview
Beach Energy Ltd is an Australian oil and gas producer. Its business is centered on finding, developing, and producing hydrocarbons, then selling that output into domestic Australian energy markets and export-linked channels. For most readers, the simplest way to think about Beach is as an upstream energy company with a growing focus on supplying natural gas, a fuel that remains important for electricity generation, industrial use, and liquefied natural gas value chains in Australia.
The company’s revenue mainly comes from selling produced hydrocarbons rather than from a large downstream refining or marketing business. Based on recent annual disclosures and asset mix, the revenue base is dominated by gas and gas-linked products, with oil and natural gas liquids making up a smaller share.
- Natural gas and gas-linked sales: approximately 60% to 75% of revenue in recent years. This includes pipeline gas sold into Australian domestic markets and production associated with LNG-linked contracts from key basins.
- Crude oil: approximately 20% to 30% of revenue. This comes from Beach’s operated and non-operated producing fields, with revenue moving up or down mainly with oil prices and output levels.
- Natural gas liquids and condensate: approximately 5% to 15% of revenue. These are hydrocarbon liquids produced alongside gas in some fields.
Operationally, the company’s most important assets are in the Cooper Basin, the Otway Basin, and the Perth Basin. These assets matter because they give Beach a portfolio across mature production, development projects, and gas supply opportunities tied to East Coast Australian demand. That mix helps explain why the business is more relevant to regional energy supply than its U.S. over-the-counter listing might suggest.
The business profile also shows a meaningful recovery in the latest fiscal year after a very weak prior period. Revenue moved back toward the high end of its recent range by fiscal 2026, and operating profit turned positive again after the large fiscal 2024 setback. That pattern suggests Beach is still highly cyclical, but not structurally impaired in the same way a prolonged multi-year collapse would imply.
The income flow over the last several years highlights how volatile this business can be. Revenue has stayed within a fairly narrow long-term band, but profits have swung sharply because commodity prices, production mix, field performance, and non-cash charges can have an outsized effect on reported earnings. The latest year shows profitability recovering, although margins remain below the strong levels seen earlier in the cycle.
Key Figures
| Metric | Value | Sector ⓘ |
|---|---|---|
| Date | Oct 17, 2026 | |
| Context | ||
| Sector | Energy | |
| Industry | Oil & Gas E&P | |
| Market Cap ⓘ | $1.44B | |
| Beta ⓘ | 0.13 | |
Value (Cheapness) | ||
| P/E Ratio ⓘ | 7.54 | 15.44 |
| P/B Ratio ⓘ | 0.44 | 1.73 |
| FCF Yield ⓘ | 51.78% | 8.20% |
| Dividend Yield ⓘ | 3.29% | 3.59% |
| EBIT / EV ⓘ | N/A | 7.46% |
| PEG ⓘ | N/A | |
Growth (Business expansion) | ||
| Revenue Growth ⓘ | -17.10% | 26.90% |
| RPS Growth (5Y CAGR) ⓘ | 1.80% | 6.90% |
| EPS Growth (5Y CAGR) ⓘ | N/A | -15.73% |
| BVPS Growth (5Y CAGR) ⓘ | -1.94% | 6.07% |
| Margin Growth (5Y Trend) ⓘ | -21.06% | 0.58% |
| FCF Growth (5Y CAGR) ⓘ | N/A | 1.86% |
| DPS Growth (5Y CAGR) ⓘ | 36.01% | 16.79% |
Quality (Business durability) | ||
| ROIC (Latest) ⓘ | N/A | 11.40% |
| ROA (Latest) ⓘ | 4.25% | 6.06% |
| ROIC (5Y Median) ⓘ | 8.93% | 10.30% |
| ROA (5Y Median) ⓘ | 5.15% | 5.42% |
| Net Debt / EBIT (Latest) ⓘ | 1.21 | 1.64 |
| Net Debt / EBIT (5Y Median) ⓘ | 0.32 | 1.83 |
| Net Debt / EBITDA (Latest) ⓘ | 0.33 | 1.08 |
| Net Debt / Assets ⓘ | 7.75% | 17.29% |
| EBITDA / Interest ⓘ | N/A | 9.64 |
| Operating Margin (Latest) ⓘ | 8.59% | 16.27% |
| Operating Margin (5Y Median) ⓘ | 20.60% | 20.39% |
| Debt to Equity (Latest) ⓘ | 19.31% | 54.76% |
| Profit Margin (Latest) ⓘ | 14.65% | 8.82% |
| Free Cash Flow (Latest) ⓘ | $744.20M | |
Momentum (Price trend) | ||
| 3Y Return ⓘ | -26.60% | +67.38% |
| 12M Return (excl. last month) ⓘ | -19.95% | +49.19% |
| 6M Return ⓘ | -26.61% | +7.07% |
| Price vs. 200-Day MA ⓘ | -24.02% | +9.56% |
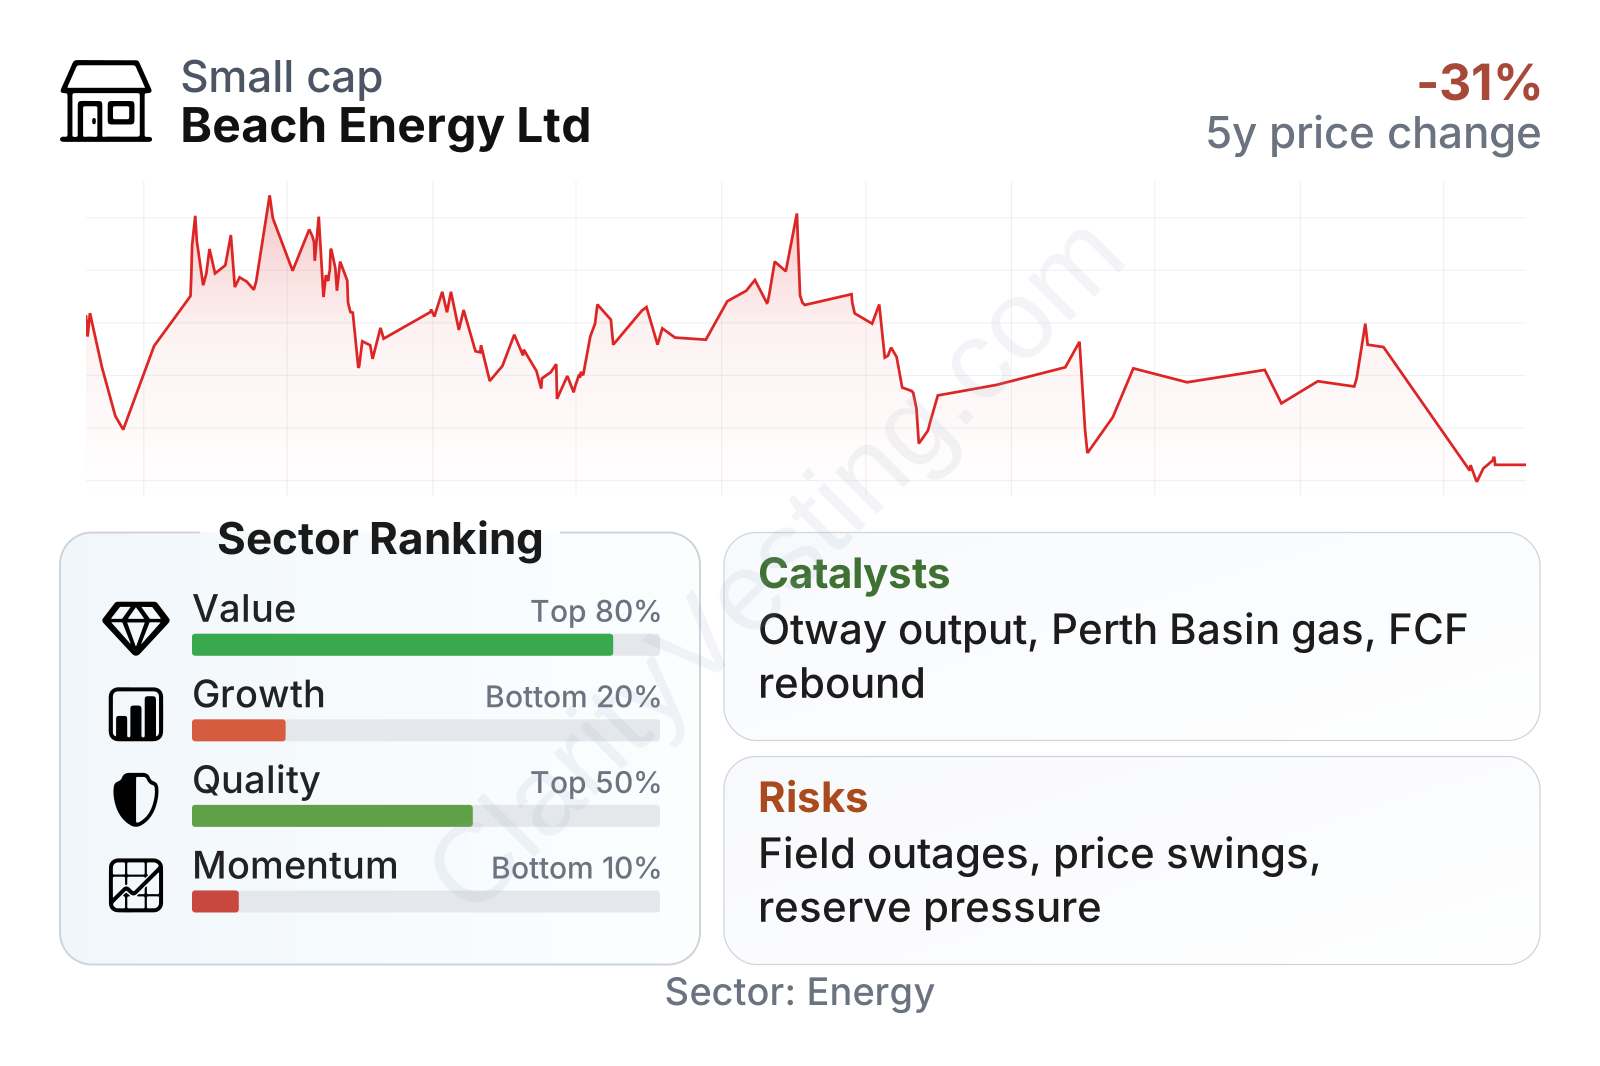
Beach Energy is a mid-sized energy producer by market value. The share price trend has been weak over several years, which matches its bottom-tier momentum ranking versus the broader energy group. At the same time, traditional valuation measures appear low: earnings and book value multiples are well below sector medians, and free cash flow yield screens very high. Quality is more mixed than weak, with leverage clearly better than many peers, while growth metrics are currently the main soft spot.
Growth
Beach operates in a sector that still has demand support, especially for natural gas in Australia. Long-term growth for oil and gas producers is not the same as for software or healthcare businesses, but gas-focused producers can still have durable opportunities when they serve constrained domestic markets. In Beach’s case, the most important industry backdrop is Australia’s need for reliable gas supply, particularly on the East Coast, where declining legacy fields and infrastructure constraints can support pricing and development economics for established producers.
The company’s strategy broadly makes sense for that setting. It has focused on lifting production from core basins, bringing development projects online, and strengthening its gas weighting. That is a reasonable approach because gas supply contracts can be less speculative than pure oil exposure, and Beach already has operating experience and infrastructure relationships in its core regions.
Near-term growth has been uneven rather than smooth. Revenue growth has shifted between positive and negative periods, and the latest trailing comparison remains below the sector median. That weak ranking reflects the operational disruptions and earnings reset seen in the last few years more than a complete absence of opportunity. It means the company still needs to prove that recent recovery can translate into steadier top-line expansion.
Cash generation also tells a two-sided story. Free cash flow turned negative during the heavier investment phase and weaker operating stretch, but the latest trailing figures point to a strong rebound. For a producer like Beach, that matters because cash flow funds development, dividends, and balance-sheet flexibility. A recovery in free cash flow is often more meaningful than a one-year earnings swing, since upstream accounting can be distorted by impairments and other non-cash items.
A key catalyst is execution on major gas developments and production reliability in the Otway and Perth basins. When an upstream producer already trades on subdued expectations, stable delivery from existing projects can matter as much as a major discovery. Another favorable element is Beach’s exposure to domestic gas demand, where supply tightness in Australia can create a more constructive backdrop than many investors assume from looking only at global oil price headlines.
Recent company updates have also emphasized progress on development activity and production guidance recovery. The significance is straightforward: Beach does not need a dramatic transformation to improve its profile. It mainly needs consistent operating delivery, better field performance, and a clearer conversion of production into sustained earnings and cash flow.
Risks
This article is for informational purposes only and does not constitute financial advice. Some content is AI-generated. See Disclaimer


