Stock Analysis · Brookfield Business Corp (BBUC)
Overview
Brookfield Business Corporation is a publicly traded vehicle that gives shareholders exposure to Brookfield’s private-equity-style industrial and services operations. In simple terms, it buys, improves, and operates businesses that management believes can produce stronger cash flow over time. The company sits within the broader Brookfield ecosystem, which is known for owning and managing real assets and operating businesses globally.
Its portfolio is diversified across several operating groups rather than built around a single product. Based on recent company reporting, revenue is mainly generated from business services, industrial operations, and infrastructure-related services, with additional exposure to construction and energy equipment distribution after more recent portfolio changes. Because Brookfield Business actively acquires, sells, and reshapes businesses, the exact mix can change meaningfully from year to year.
The latest revenue base is much larger than it was a few years ago, which reflects acquisitions and portfolio repositioning more than simple organic expansion. A practical way to view the business is as a collection of mid-sized and large operating companies managed under one capital allocation framework.
The most important revenue sources can be summarized as follows:
- Business and industrial services: a large share of sales comes from service-oriented and operational businesses that support customers in areas such as outsourcing, distribution, and essential business operations.
- Manufacturing and engineered products: owned companies in industrial and production-related activities contribute a meaningful portion of revenue through equipment, components, and specialized products.
- Infrastructure and field services: certain subsidiaries provide maintenance, operational support, or project-linked services tied to essential assets and networks.
- Construction and energy equipment distribution: this has become more important after recent acquisitions, helping explain the sharp increase in consolidated sales.
Precise percentages by operating line are not always stable enough to present as durable long-term weights because the portfolio changes regularly. That is a key feature of the company: Brookfield Business is not a static industrial firm, but an actively managed collection of businesses.
The long-term financial profile shows a business that has expanded revenue materially, but with uneven conversion into net earnings. Operating income improved strongly over time, yet interest expense has remained heavy, which helps explain why bottom-line results have been much more volatile than revenue growth alone would suggest.
Key Figures
| Metric | Value | Sector ⓘ |
|---|---|---|
| Date | Oct 17, 2026 | |
| Context | ||
| Sector | Industrials | |
| Industry | Conglomerates | |
| Market Cap ⓘ | $5.35B | |
| Beta ⓘ | 1.39 | |
Value (Cheapness) | ||
| P/E Ratio ⓘ | N/A | 22.10 |
| P/B Ratio ⓘ | 0.97 | 1.97 |
| FCF Yield ⓘ | 7.51% | 6.38% |
| Dividend Yield ⓘ | 0.94% | 1.94% |
| EBIT / EV ⓘ | 6.94% | 4.79% |
| PEG ⓘ | N/A | |
Growth (Business expansion) | ||
| Revenue Growth ⓘ | -3.00% | 9.30% |
| RPS Growth (5Y CAGR) ⓘ | 35.11% | 7.81% |
| EPS Growth (5Y CAGR) ⓘ | N/A | -13.06% |
| BVPS Growth (5Y CAGR) ⓘ | N/A | 6.14% |
| Margin Growth (5Y Trend) ⓘ | 11.60% | 0.88% |
| FCF Growth (5Y CAGR) ⓘ | N/A | 11.01% |
| DPS Growth (5Y CAGR) ⓘ | -11.85% | 9.48% |
Quality (Business durability) | ||
| ROIC (Latest) ⓘ | 7.57% | 10.84% |
| ROA (Latest) ⓘ | -0.92% | 5.41% |
| ROIC (5Y Median) ⓘ | 4.22% | 9.38% |
| ROA (5Y Median) ⓘ | 0.22% | 4.95% |
| Net Debt / EBIT (Latest) ⓘ | 13.00 | 2.08 |
| Net Debt / EBIT (5Y Median) ⓘ | 29.69 | 2.27 |
| Net Debt / EBITDA (Latest) ⓘ | 6.68 | 1.39 |
| Net Debt / Assets ⓘ | 53.58% | 19.28% |
| EBITDA / Interest ⓘ | N/A | 9.58 |
| Operating Margin (Latest) ⓘ | 15.04% | 10.50% |
| Operating Margin (5Y Median) ⓘ | 6.42% | 10.29% |
| Debt to Equity (Latest) ⓘ | 841.13% | 65.48% |
| Profit Margin (Latest) ⓘ | -0.20% | 6.67% |
| Free Cash Flow (Latest) ⓘ | $402.00M | |
Momentum (Price trend) | ||
| 3Y Return ⓘ | +64.71% | +61.68% |
| 12M Return (excl. last month) ⓘ | -23.00% | +12.58% |
| 6M Return ⓘ | -23.93% | 0.00% |
| Price vs. 200-Day MA ⓘ | -17.14% | +0.02% |
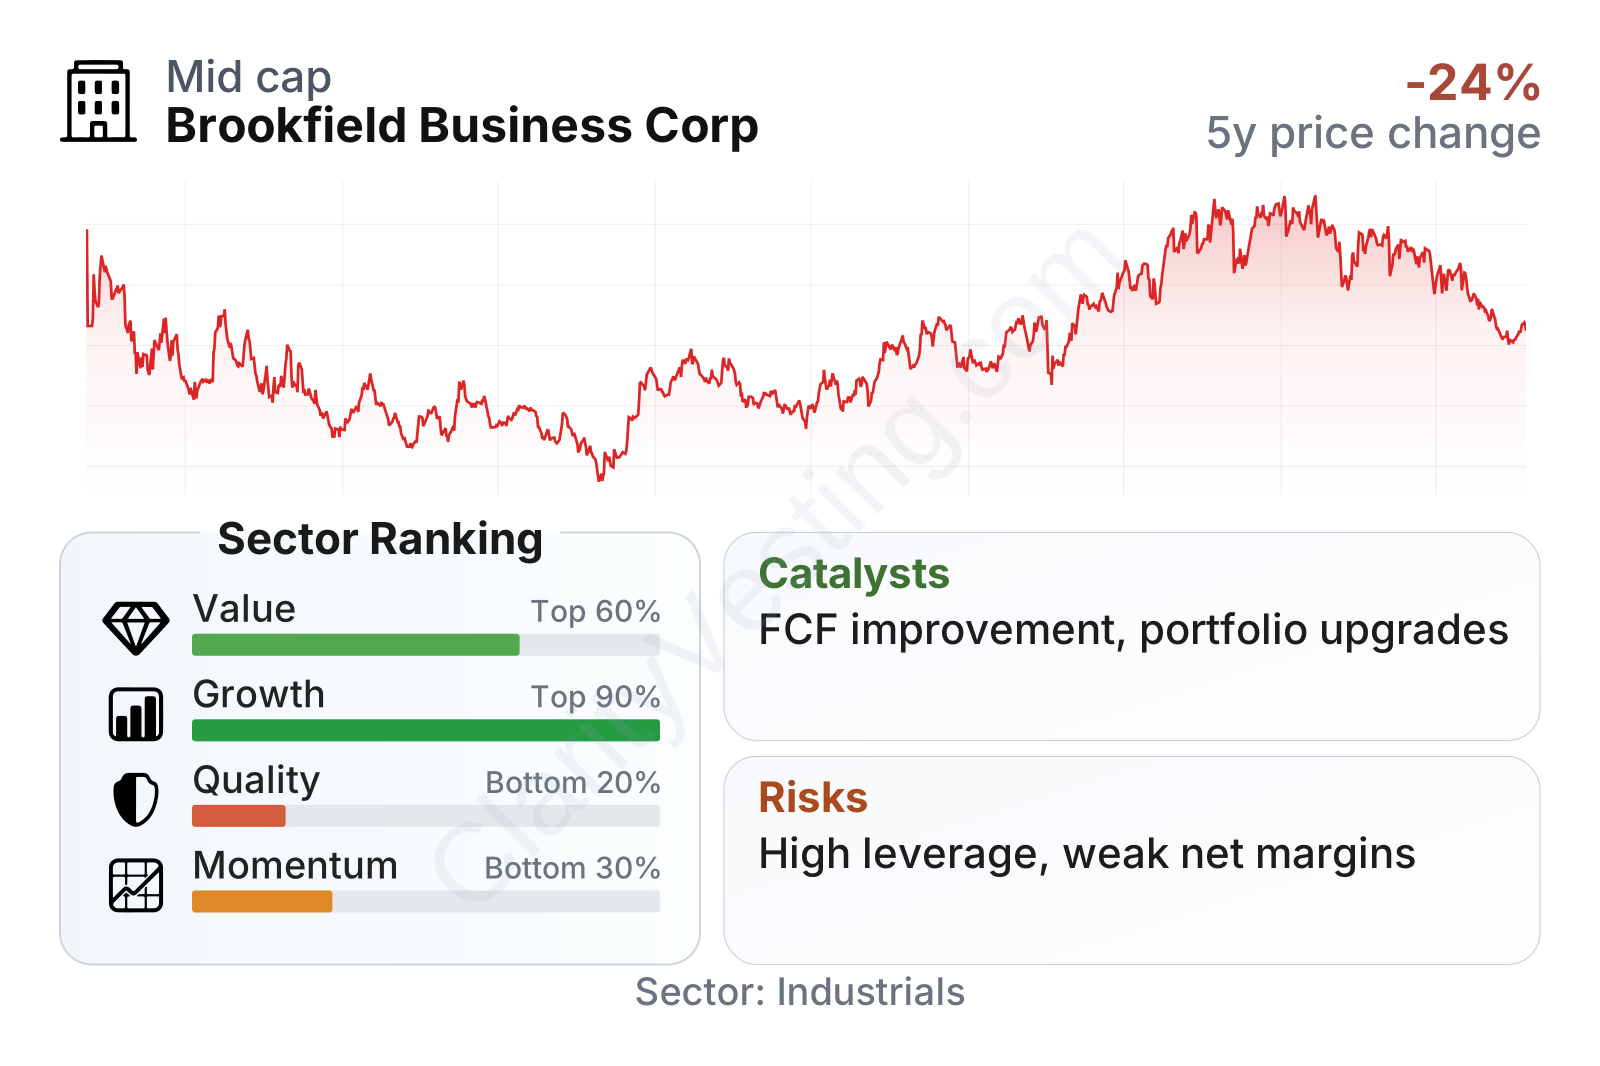
Brookfield Business is a mid-cap company with share-price volatility above the market average. The overall picture is mixed: valuation metrics look relatively undemanding versus much of the industrial sector, growth metrics are strong over a multiyear period, but quality and momentum are clearly weaker. The table suggests a company that has built scale and cash generation, yet still carries balance-sheet and profitability issues that keep market confidence restrained.
The recent stock path also reflects that tension. The shares recovered strongly into late 2025, then pulled back in 2026, which is consistent with a company whose market view can shift quickly when leverage, earnings quality, or deal execution become more important than headline revenue growth.
Growth
Brookfield Business operates in sectors where consolidation, operational improvement, and asset rotation can create value, even if the company itself is not a pure play on one obvious high-growth theme such as software or semiconductors. Its growth case rests more on strategy than on belonging to a fashionable industry. Management’s model is to acquire businesses where operational upgrades, pricing discipline, cost control, and capital investment can lift earnings over time.
That strategy is coherent for long-term analysis because Brookfield has a long record, at the broader group level, of buying complex or under-optimized businesses and trying to improve them. For Brookfield Business specifically, the strongest catalyst is often portfolio transformation: new acquisitions can quickly reshape scale, margins, and cash flow.
Revenue growth has been very uneven on a quarterly basis, which is typical for an acquisition-driven group. Short-term swings can look extreme because the comparison periods may include acquisitions, disposals, or changes in consolidation. Even so, the broader trend points to a business that is much larger than it was several years ago. The five-year revenue-per-share growth profile is notably stronger than the sector median, which indicates that expansion has been substantial despite periodic setbacks.
Free cash flow is an especially important measure here because it shows whether the operating businesses are turning accounting results into usable cash. The recent move from negative free cash flow to solidly positive territory is one of the more constructive signals in the current profile. It suggests the portfolio may be stabilizing after a period of heavy investment, integration work, and earnings pressure.
A further growth catalyst is Brookfield’s access to capital, operating expertise, and deal flow through the broader Brookfield platform. That does not remove risk, but it can provide opportunities that many standalone industrial holding companies would struggle to access. If management continues rotating capital from mature or weaker assets into better businesses, future earnings quality could improve along with scale.
Recent company activity has continued to emphasize business building, portfolio recycling, and operational improvement rather than passive ownership. That is relevant because Brookfield Business is best understood as an active owner trying to create value through change, not simply through economic growth in its end markets.
Risks
This article is for informational purposes only and does not constitute financial advice. Some content is AI-generated. See Disclaimer


