Stock Analysis · Beacon Financial Corporation (BBT)
Overview
Beacon Financial Corporation is a regional banking company. It gathers deposits from consumers and businesses, makes loans, earns interest on those loans and securities, and collects fees from banking services. Like many banks of its size, its economic engine is largely built on the spread between what it earns on loans and investments and what it pays to fund itself.
The available public financial breakdown indicates that revenue is still dominated by interest-related banking activity, while fee income plays a secondary role. Exact segment percentages are not fully standardized in the material available here, but the business mix can be described in a practical order from largest to smallest:
- Net interest income: approximately 70% to 85% of total revenue in a typical year. This includes interest earned on commercial loans, consumer loans, mortgage-related lending, and investment securities, minus interest paid on deposits and other funding.
- Service charges and deposit-related fees: approximately 5% to 10%. This usually includes account fees, treasury management, and transaction-related income.
- Mortgage banking and loan-related fees: approximately 5% to 10%. This can include loan origination, servicing, and secondary market activity.
- Other non-interest income: approximately 5% to 15%. This tends to cover card income, wealth-related activities if applicable, gains on sales, and other banking service fees.
Over the last several years, total revenue has moved higher overall, reaching a meaningfully larger level by 2025 than in 2021. However, the path has not been smooth. Rising interest expense has taken a much larger share of revenue since 2023, which helps explain why revenue growth has not translated into equally strong profitability.
The income flow shows a bank that has expanded revenue but also faced a sharp increase in funding costs. Operating expenses have been relatively more controlled than interest expense, so the main pressure point has come from the cost of money rather than day-to-day overhead.
Key Figures
| Metric | Value | Sector ⓘ |
|---|---|---|
| Date | Oct 24, 2026 | |
| Context | ||
| Sector | Financial Services | |
| Industry | Banks - Regional | |
| Market Cap ⓘ | $2.35B | |
| Beta ⓘ | 0.92 | |
Value (Cheapness) | ||
| P/E Ratio ⓘ | 7.57 | 12.46 |
| P/B Ratio ⓘ | 1.00 | 1.25 |
| FCF Yield ⓘ | 9.20% | 9.82% |
| Dividend Yield ⓘ | 4.62% | 2.94% |
| EBIT / EV ⓘ | N/A | 8.11% |
| PEG ⓘ | 2.60 | |
Growth (Business expansion) | ||
| Revenue Growth ⓘ | 144.50% | 9.10% |
| RPS Growth (5Y CAGR) ⓘ | 16.82% | 12.31% |
| EPS Growth (5Y CAGR) ⓘ | 0.48% | -6.97% |
| BVPS Growth (5Y CAGR) ⓘ | 29.75% | 5.02% |
| Margin Growth (5Y Trend) ⓘ | -16.29% | -4.00% |
| FCF Growth (5Y CAGR) ⓘ | 13.37% | 4.71% |
| DPS Growth (5Y CAGR) ⓘ | 17.47% | 8.92% |
Quality (Business durability) | ||
| ROIC (Latest) ⓘ | N/A | 9.18% |
| ROE (Latest) ⓘ | 8.98% | 13.93% |
| ROA (Latest) ⓘ | 1.00% | 1.57% |
| ROIC (5Y Median) ⓘ | N/A | 7.80% |
| ROE (5Y Median) ⓘ | 6.35% | 12.15% |
| ROA (5Y Median) ⓘ | 0.68% | 1.28% |
| Net Debt / EBIT (Latest) ⓘ | N/A | 1.02 |
| Net Debt / EBIT (5Y Median) ⓘ | 9.39 | 0.72 |
| Net Debt / EBITDA (Latest) ⓘ | 4.25 | 0.88 |
| Operating Margin (Latest) ⓘ | N/A | 22.30% |
| Operating Margin (5Y Median) ⓘ | 16.05% | 24.50% |
| Debt to Equity (Latest) ⓘ | 38.57% | 59.34% |
| Profit Margin (Latest) ⓘ | 21.04% | 26.42% |
| Free Cash Flow (Latest) ⓘ | $216.00M | |
Momentum (Price trend) | ||
| 3Y Return ⓘ | +74.67% | +95.73% |
| 12M Return (excl. last month) ⓘ | +18.75% | +17.30% |
| 6M Return ⓘ | -2.14% | +6.07% |
| Price vs. 200-Day MA ⓘ | +1.82% | +5.36% |
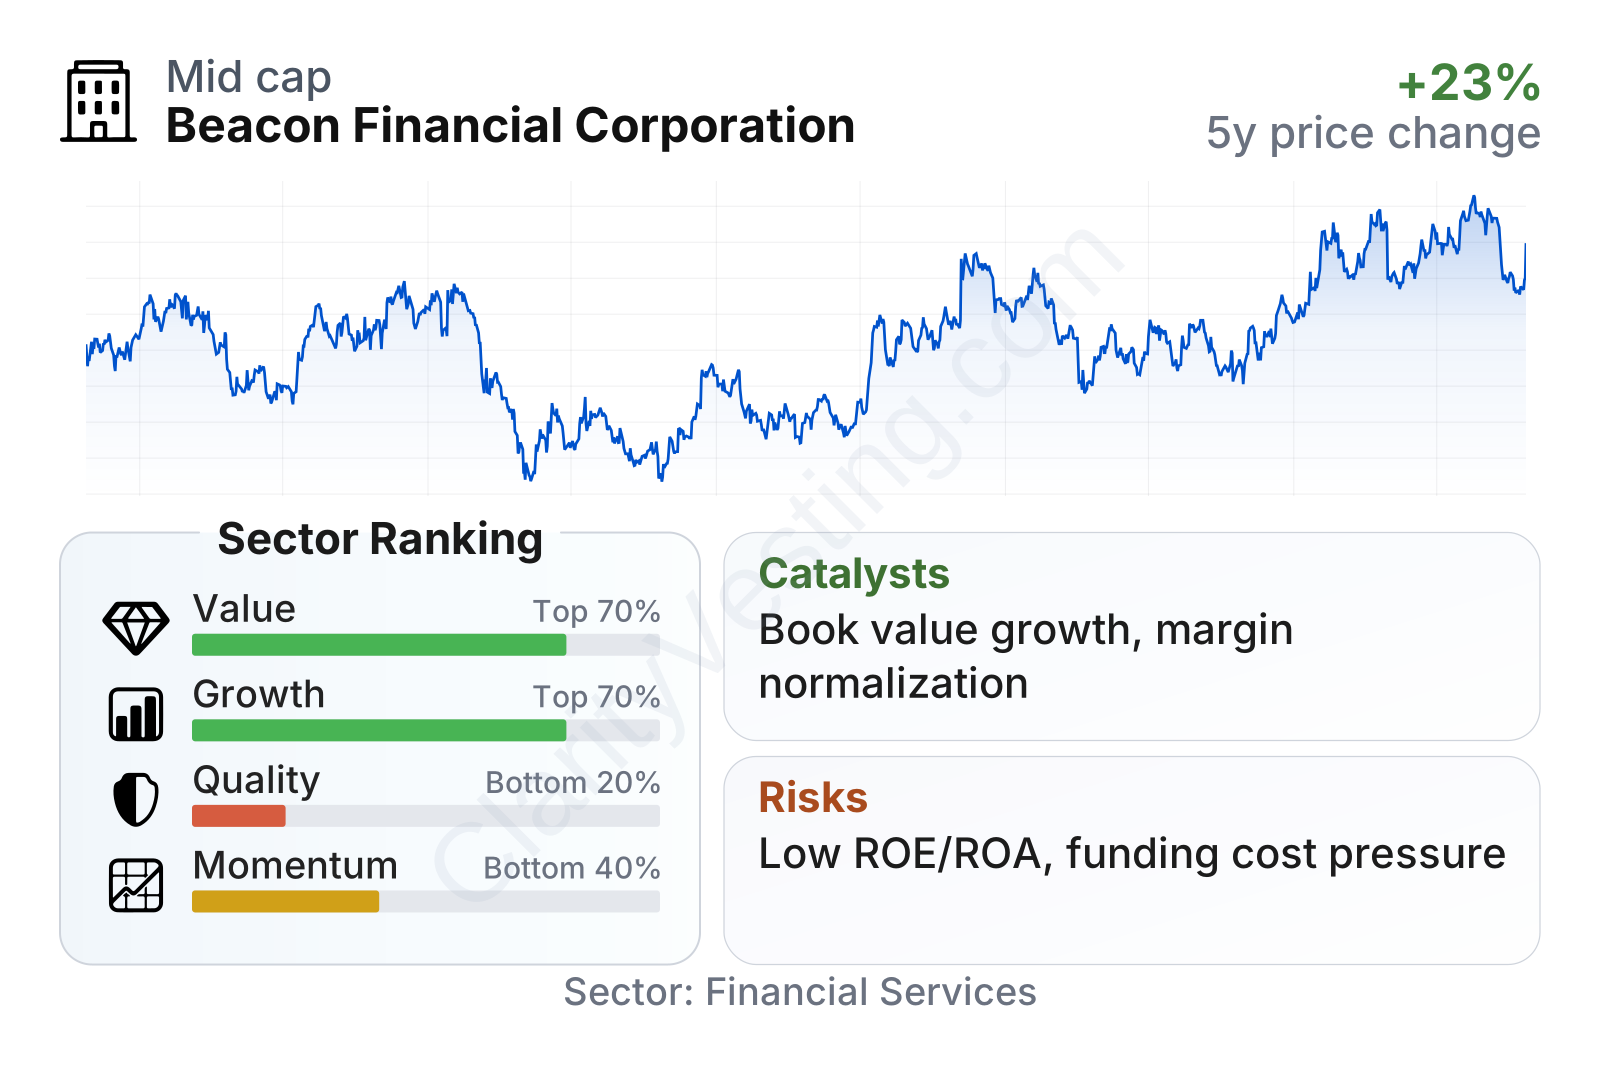
Beacon is a small-cap regional bank with a market value a little above $2 billion and a stock volatility that has been close to the broader market. On valuation, it screens cheaper than the sector median on both earnings and book value, and its dividend yield is above the sector median. Growth indicators are mixed but not weak overall: revenue expansion has been strong recently, book value per share has compounded at a fast pace over five years, and dividend growth has also been solid. The clear weak point is quality. Profitability ratios such as return on equity and return on assets remain well below typical regional bank levels, which limits how much weight the low valuation can carry by itself.
The stock chart also reflects that contrast. The shares have recovered strongly from their 2023 lows and are well above the levels seen a few years ago, but shorter-term momentum has softened compared with many peers.
Growth
Beacon operates in regional banking, a sector that does not usually deliver technology-like expansion but can still grow steadily through loan growth, deposit gathering, market share gains in local communities, and acquisitions. Long-term demand for banking services remains durable because households and small and midsize businesses continue to need credit, payment services, treasury support, and deposit products. That said, growth in banking is heavily tied to interest rates, credit quality, and local economic conditions.
Beacon’s recent operating trend suggests there is a real growth angle, but it is not a simple one. Revenue growth has been very strong on a year-over-year basis, far ahead of the sector median, and revenue per share over five years has also grown faster than the typical regional bank. This indicates that the franchise has been expanding. A notable support for that view is the strong rise in book value per share over time, which usually matters a great deal for banks because book value represents the capital base that supports future lending and earnings capacity.
Earnings per share have improved overall since 2021, though the progression has been uneven rather than consistently upward. That pattern suggests the company has growth potential, but not yet the kind of stable profit compounding that would clearly separate it from the pack.
The increase in book value per share is one of the more constructive elements in Beacon’s profile. The jump by 2025 is especially important because it changes the relationship between the share price and the bank’s underlying equity base. In simple terms, the company appears to have built balance-sheet value faster than the stock price has kept up with it.
A practical catalyst for future growth would be margin normalization if deposit costs stabilize or decline while loan yields remain healthy. Another would be successful redeployment of capital into higher-yielding loans without a sharp deterioration in credit quality. The rise in the dividend yield over recent quarters also suggests the market is recognizing income generation, even if profitability still needs improvement.
There does not appear to be a single transformative public event that redefines Beacon’s outlook on its own. Instead, the opportunity is more incremental: stronger earnings conversion from the existing balance sheet, better funding costs, and continued growth in tangible equity.
Risks
This article is for informational purposes only and does not constitute financial advice. Some content is AI-generated. See Disclaimer


