Stock Analysis · Banner Corporation (BANR)
Overview
Banner Corporation is the parent company of Banner Bank, a regional bank headquartered in the Pacific Northwest. It provides traditional banking services to consumers, small and midsize businesses, commercial real estate customers, and public sector clients. Its branch network and lending footprint are concentrated in Washington, Oregon, California, and Idaho, with banking activities still centered on gathering deposits and turning those funds into loans and other interest-earning assets.
For a bank like Banner, revenue is best understood through the mix of net interest income and non-interest income. Net interest income is the spread between what the bank earns on loans and securities and what it pays on deposits and other funding. Non-interest income covers service charges, mortgage banking, wealth and treasury management fees, card-related income, and other banking services. Based on recent annual reporting, Banner’s revenue mix is heavily weighted toward spread income.
- Net interest income: approximately 85% to 90% of total revenue. This is the core engine of the business and includes income from commercial loans, real estate lending, consumer loans, and investment securities, minus interest paid on deposits and borrowings.
- Non-interest income: approximately 10% to 15% of total revenue. This includes deposit account fees, mortgage banking revenue, bank card fees, wealth management and treasury services, and other customer service fees.
Within lending, commercial real estate and commercial business banking remain important categories, while residential mortgage and consumer banking broaden the franchise. On the funding side, low-cost customer deposits are especially important because they shape profitability when interest rates move.
The business has expanded revenue meaningfully over the last several years, but profit conversion has been less smooth. Revenue rose from roughly the low-$600 million range a few years ago to above $800 million more recently, while interest expense also climbed sharply as deposit costs reset higher. That pattern is common across regional banking after the rate shock of 2022–2024, and it helps explain why stronger revenue did not translate into a straight-line improvement in earnings.
Key Figures
| Metric | Value | Sector ⓘ |
|---|---|---|
| Date | Oct 03, 2026 | |
| Context | ||
| Sector | Financial Services | |
| Industry | Banks - Regional | |
| Market Cap ⓘ | $2.45B | |
| Beta ⓘ | 0.82 | |
Value (Cheapness) | ||
| P/E Ratio ⓘ | 10.97 | 12.60 |
| P/B Ratio ⓘ | 1.15 | 1.23 |
| FCF Yield ⓘ | 11.62% | 10.16% |
| Dividend Yield ⓘ | 2.96% | 2.96% |
| EBIT / EV ⓘ | 12.77% | 7.77% |
| PEG ⓘ | 1.83 | |
Growth (Business expansion) | ||
| Revenue Growth ⓘ | 6.90% | 9.50% |
| RPS Growth (5Y CAGR) ⓘ | 7.16% | 12.10% |
| EPS Growth (5Y CAGR) ⓘ | -15.44% | -9.45% |
| BVPS Growth (5Y CAGR) ⓘ | -41.16% | 5.01% |
| Margin Growth (5Y Trend) ⓘ | -9.64% | -4.07% |
| FCF Growth (5Y CAGR) ⓘ | -3.93% | 4.96% |
| DPS Growth (5Y CAGR) ⓘ | 4.43% | 8.79% |
Quality (Business durability) | ||
| ROIC (Latest) ⓘ | 11.49% | 9.60% |
| ROE (Latest) ⓘ | 10.65% | 13.84% |
| ROA (Latest) ⓘ | 1.26% | 1.53% |
| ROIC (5Y Median) ⓘ | 9.07% | 7.86% |
| ROE (5Y Median) ⓘ | 2.13% | 12.20% |
| ROA (5Y Median) ⓘ | 1.20% | 1.29% |
| Net Debt / EBIT (Latest) ⓘ | 1.08 | 0.91 |
| Net Debt / EBIT (5Y Median) ⓘ | 0.50 | 0.74 |
| Net Debt / EBITDA (Latest) ⓘ | 2.45 | 0.97 |
| Operating Margin (Latest) ⓘ | 45.91% | 22.12% |
| Operating Margin (5Y Median) ⓘ | 30.62% | 24.39% |
| Debt to Equity (Latest) ⓘ | 27.32% | 60.37% |
| Profit Margin (Latest) ⓘ | 31.03% | 26.62% |
| Free Cash Flow (Latest) ⓘ | $285.17M | |
Momentum (Price trend) | ||
| 3Y Return ⓘ | +79.32% | +89.23% |
| 12M Return (excl. last month) ⓘ | +5.60% | +17.35% |
| 6M Return ⓘ | +11.33% | +10.00% |
| Price vs. 200-Day MA ⓘ | +3.42% | +3.73% |
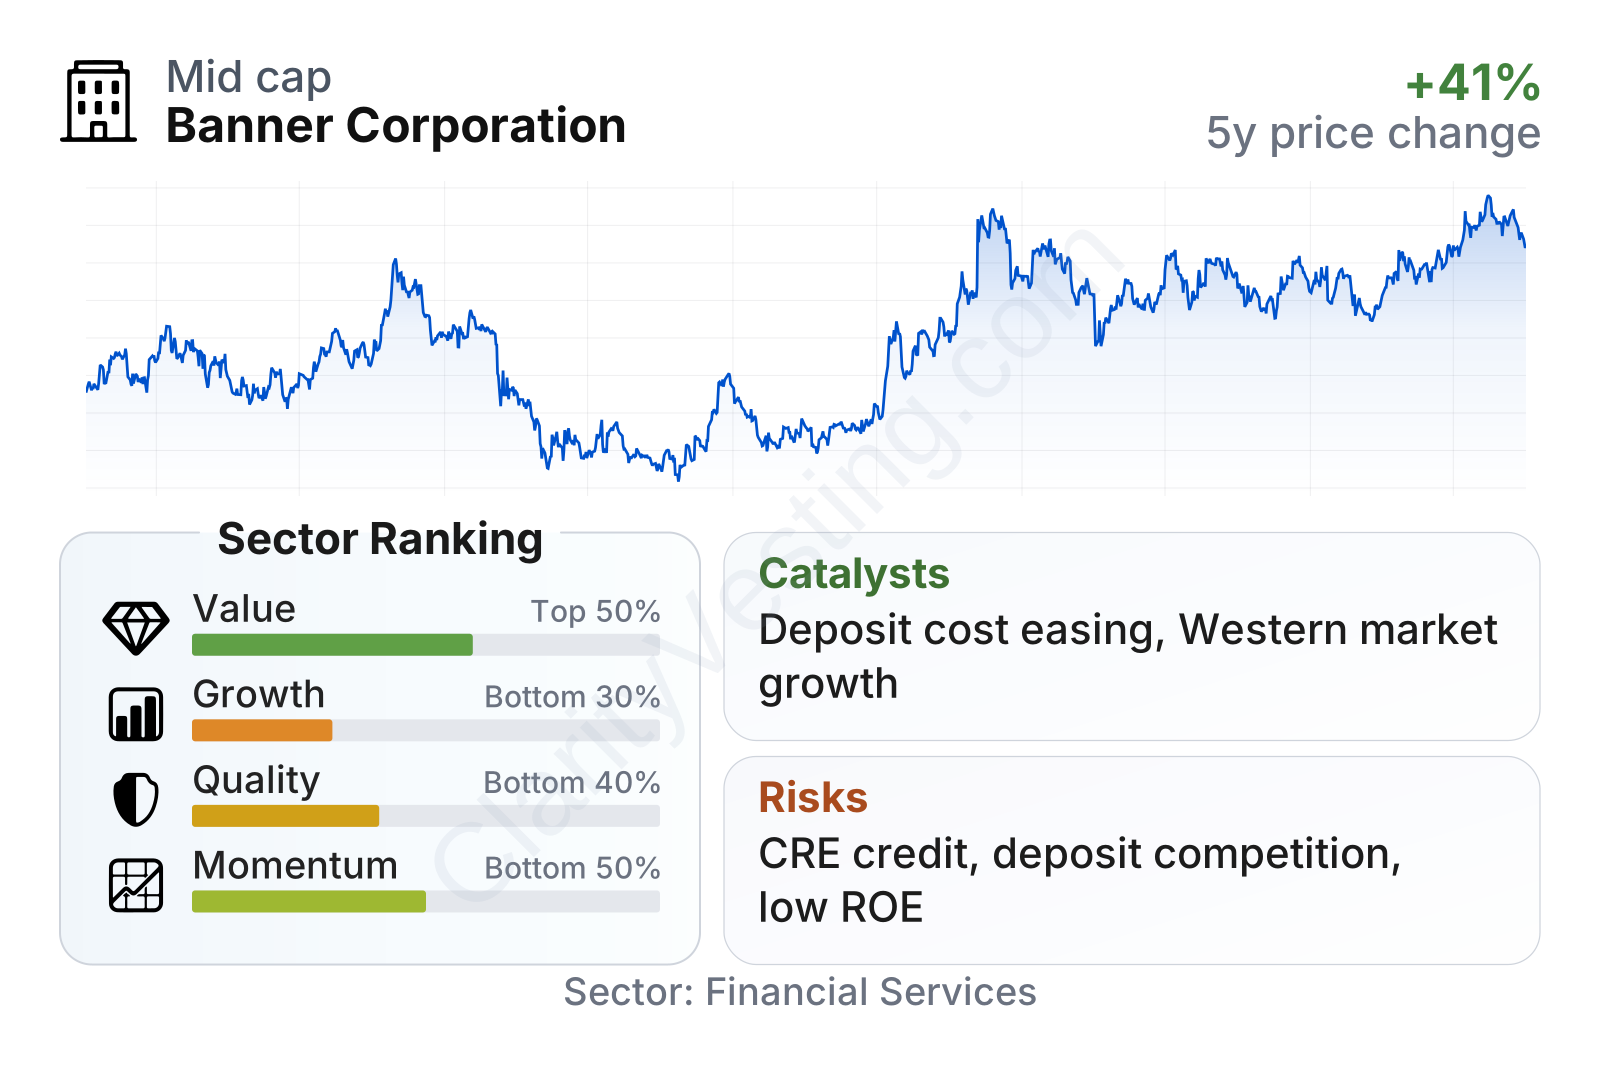
Banner sits in the mid-cap range for regional banks and shows a mixed profile. Valuation metrics look modest compared with the sector median, with both earnings and book-based multiples slightly below typical peers. Profitability is respectable, especially on operating margin and profit margin, but growth ranks weaker than much of the sector, and recent share-price momentum has been only average. The combination suggests a bank that is financially solid and profitable, but not currently being valued like a fast-growing franchise.
The stock history also reflects that profile. The shares were hit during the regional banking stress period in 2023, then recovered strongly through 2024 and into 2025, with further gains in 2026. That rebound indicates confidence has returned, but the trading path has still been more cyclical than that of the strongest national banking franchises.
Growth
Banner operates in a mature sector, not a high-growth one. Regional banking usually grows through a mix of loan expansion, deposit gathering, selective acquisitions, fee-based services, and disciplined pricing rather than through disruptive innovation. That does not make growth unattractive; it simply means long-term progress depends on consistent execution and credit discipline more than rapid market share grabs.
Its strategy is sensible for that environment. Banner has continued building commercial relationships, treasury management capabilities, and customer deposits in attractive Western markets. Those states benefit from population growth, business formation, and long-run housing demand, even if they can be cyclical in weaker economic periods. For a regional bank, having a meaningful footprint in economically active parts of the West is a credible platform for steady expansion.
Earnings per share have been resilient rather than explosive. Results moved around over the last several years, with a dip in 2024 followed by improvement in 2025. That pattern fits the broader industry reality: funding costs rose quickly, squeezing margins, and banks then had to rebuild profitability through repricing loans, controlling expenses, and protecting deposit relationships. Banner appears to be doing that, but not at a pace that stands out versus faster-growing peers.
Book value per share is especially important for banks because it reflects the equity base supporting the franchise. After a period of pressure tied to rate-driven balance-sheet marks and industry stress, Banner’s book value has recovered and moved higher in more recent periods. That improvement matters because it suggests the balance sheet is stabilizing and internal capital generation is again supporting franchise value.
A practical catalyst is the possibility of a more favorable margin environment if deposit-cost pressure eases faster than asset yields decline. Another support is Banner’s continued focus on relationship banking rather than pure rate competition. If the bank can retain core deposits, grow loans selectively, and deepen fee-based commercial services, earnings quality could improve without requiring aggressive balance-sheet risk.
Recent company updates have also emphasized capital strength, credit discipline, and ongoing customer relationship growth. In the current regional banking landscape, simply demonstrating stability, liquidity, and normalized profitability can itself be an opportunity, because the market has become more selective about which banks deserve stronger valuation multiples.
Risks
This article is for informational purposes only and does not constitute financial advice. Some content is AI-generated. See Disclaimer


