Stock Analysis · Bank of America Corp (BAC)
Overview
Bank of America is one of the largest banks in the United States. It provides everyday banking services for consumers and small businesses, lending to companies, wealth management for affluent clients, and trading and advisory services for institutions. Its scale matters because banking is partly a volume business: a larger deposit base, broader client network, and wider product range can support earnings across different economic environments.
The company organizes its business into four main segments. Based on recent annual reporting, revenue is spread across the franchise in a fairly diversified way, although consumer banking remains the biggest contributor.
- Consumer Banking: about 38% of total revenue. This includes checking and savings accounts, credit cards, residential mortgages, auto lending, and small business banking.
- Global Banking: about 26%. This covers commercial lending, treasury services, investment banking, and relationships with middle-market and large corporate clients.
- Global Markets: about 21%. This segment includes sales and trading in fixed income, currencies, commodities, and equities, plus market-making services for institutional customers.
- Global Wealth and Investment Management: about 15%. This includes Merrill wealth management and Bank of America Private Bank, which generate fees from advisory, brokerage, and asset-based relationships.
That mix is important for long-term analysis. Consumer and commercial banking bring deposit and lending income, while wealth management and markets add fee income and capital markets exposure. In practice, this gives Bank of America multiple earnings engines rather than dependence on a single activity.
The business flow also shows a clear pattern over the last several years: revenue has moved higher overall, operating income has remained solid, and net income has stayed in the tens of billions of dollars even while funding costs and expenses rose. That suggests resilience, but also confirms that profitability is sensitive to rates and operating efficiency.
Over time, total revenue has climbed from the high tens of billions of dollars to above $110 billion, while earnings have recovered after pressure from higher funding costs. The broad direction is positive, although expenses have also moved up and margin expansion has not been linear.
Key Figures
| Metric | Value | Sector ⓘ |
|---|---|---|
| Date | Oct 03, 2026 | |
| Context | ||
| Sector | Financial Services | |
| Industry | Banks - Diversified | |
| Market Cap ⓘ | $380.62B | |
| Beta ⓘ | 1.16 | |
Value (Cheapness) | ||
| P/E Ratio ⓘ | 12.57 | 12.60 |
| P/B Ratio ⓘ | 1.30 | 1.23 |
| FCF Yield ⓘ | 24.89% | 10.16% |
| Dividend Yield ⓘ | 2.04% | 2.96% |
| EBIT / EV ⓘ | N/A | 7.77% |
| PEG ⓘ | 0.85 | |
Growth (Business expansion) | ||
| Revenue Growth ⓘ | 16.80% | 9.50% |
| RPS Growth (5Y CAGR) ⓘ | 9.53% | 12.10% |
| EPS Growth (5Y CAGR) ⓘ | -8.15% | -9.45% |
| BVPS Growth (5Y CAGR) ⓘ | 8.81% | 5.01% |
| Margin Growth (5Y Trend) ⓘ | -4.80% | -4.07% |
| FCF Growth (5Y CAGR) ⓘ | N/A | 4.96% |
| DPS Growth (5Y CAGR) ⓘ | 7.72% | 8.79% |
Quality (Business durability) | ||
| ROIC (Latest) ⓘ | N/A | 9.60% |
| ROE (Latest) ⓘ | 10.91% | 13.84% |
| ROA (Latest) ⓘ | 0.98% | 1.53% |
| ROIC (5Y Median) ⓘ | 4.91% | 7.86% |
| ROE (5Y Median) ⓘ | 9.70% | 12.20% |
| ROA (5Y Median) ⓘ | 0.89% | 1.29% |
| Net Debt / EBIT (Latest) ⓘ | N/A | 0.91 |
| Net Debt / EBIT (5Y Median) ⓘ | 3.56 | 0.74 |
| Net Debt / EBITDA (Latest) ⓘ | 15.41 | 0.97 |
| Operating Margin (Latest) ⓘ | N/A | 22.12% |
| Operating Margin (5Y Median) ⓘ | 32.62% | 24.39% |
| Debt to Equity (Latest) ⓘ | 243.13% | 60.37% |
| Profit Margin (Latest) ⓘ | 29.52% | 26.62% |
| Free Cash Flow (Latest) ⓘ | $94.74B | |
Momentum (Price trend) | ||
| 3Y Return ⓘ | +116.23% | +89.23% |
| 12M Return (excl. last month) ⓘ | +24.83% | +17.35% |
| 6M Return ⓘ | +10.18% | +10.00% |
| Price vs. 200-Day MA ⓘ | -1.98% | +3.73% |
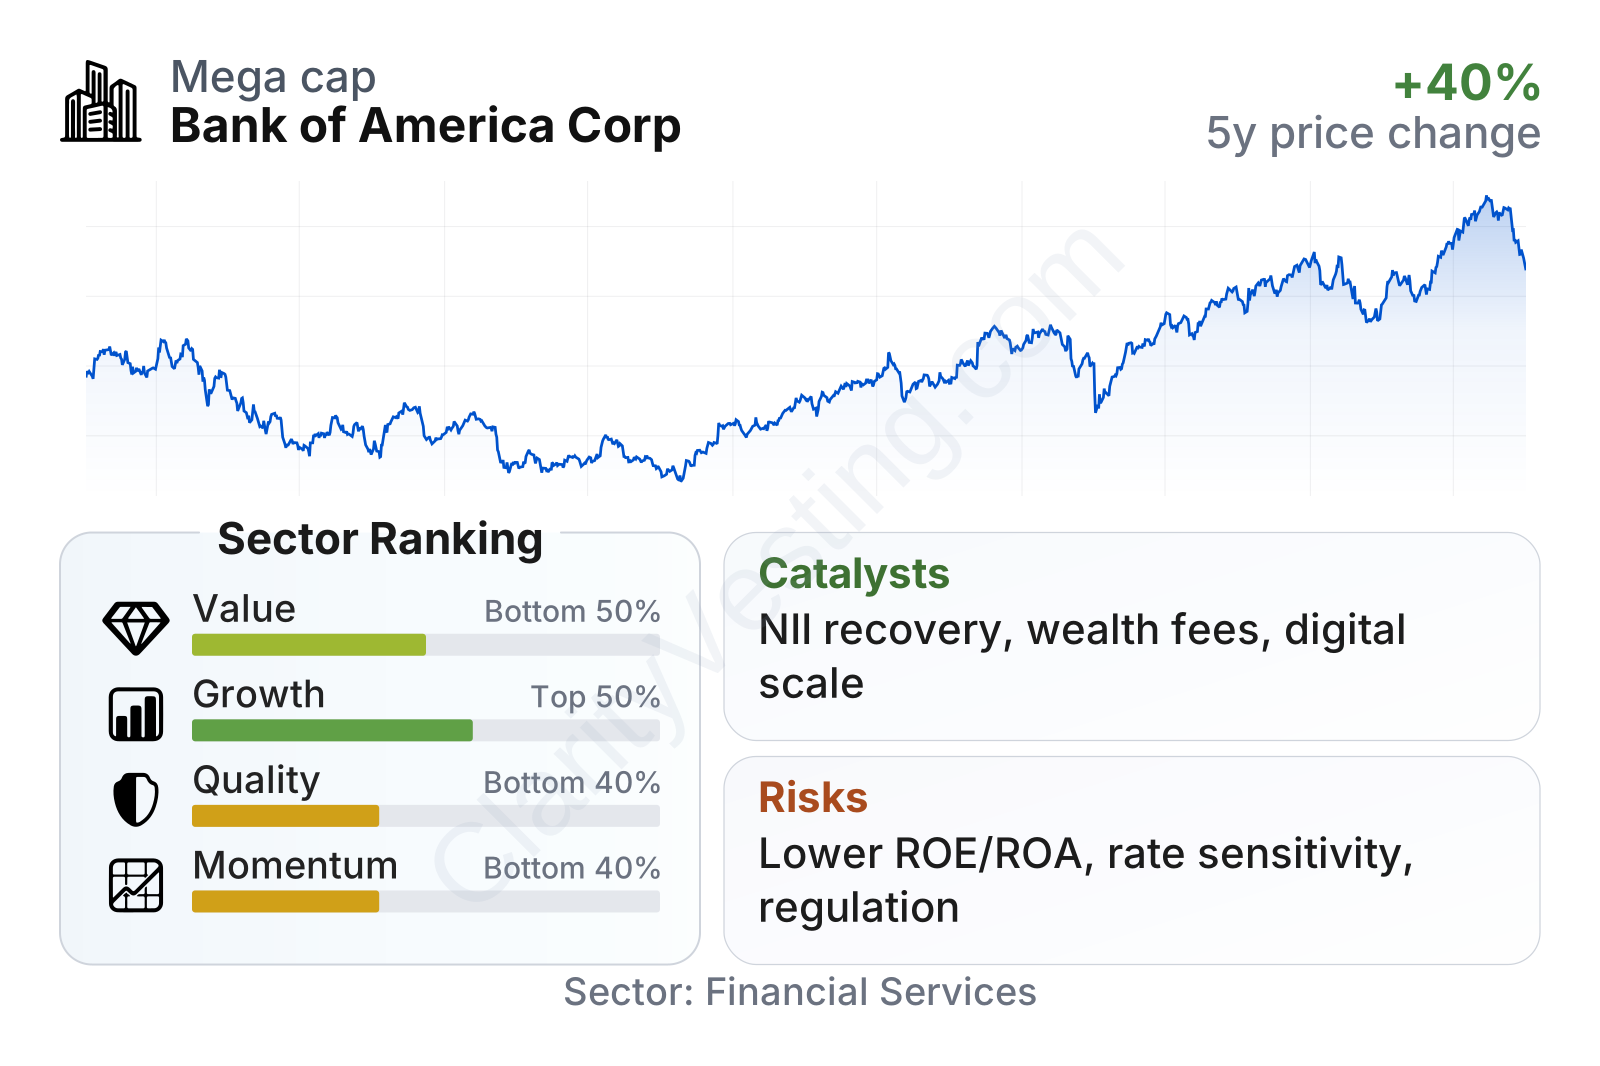
Bank of America is a very large financial institution with market value in the hundreds of billions of dollars, so it has meaningful scale and broad market access. On valuation, its earnings multiple is close to the sector median, while its price-to-book ratio is modestly above the sector median. Growth metrics look somewhat better than the middle of the sector, helped by stronger recent revenue growth and steady growth in book value per share. Quality metrics are more mixed: profit margin is healthy, but returns on equity and assets remain below the sector median. Momentum has been respectable over multi-year and recent periods, though not strong enough to place it among the sector’s stronger current leaders.
Growth
Banking is not usually described as a high-growth industry, but it is a foundational sector that can still compound through credit growth, fee income, wealth management expansion, and technology-led productivity gains. For Bank of America, the long-term case depends less on rapid disruption and more on whether it can deepen customer relationships, defend deposits, improve efficiency, and steadily grow earnings through cycles.
Its strategy is coherent. The company has a national consumer franchise, a major corporate bank, a large wealth management platform, and a substantial institutional markets business. This combination allows it to capture value from clients at different stages: everyday banking, lending, investing, payments, and capital markets. That ecosystem can strengthen retention and increase revenue per customer over time.
A major catalyst is interest income sensitivity. Large banks with sizable deposit franchises can benefit when they manage the spread between what they earn on loans and securities and what they pay on deposits. At the same time, a more normalized capital markets environment can help investment banking and trading. If both engines improve together, earnings can rise faster than they would from loan growth alone.
Another supportive factor is wealth management. This business tends to produce recurring fee revenue, requires less balance-sheet intensity than lending, and can become more valuable as client assets rise with markets over time. For a bank of this size, growing fee-heavy businesses is one of the cleaner ways to improve the overall earnings mix.
Earnings per share show that results have not moved in a straight line, but the direction improved from 2023 through 2025 after a softer period. That pattern fits a large bank working through changing rates, deposit pricing pressure, and uneven capital markets activity rather than a structurally weakening franchise.
Book value per share has risen steadily over the last several years, which is a useful sign for a bank because book value reflects the capital base supporting future earnings. The growth rate has been better than the sector median over five years, suggesting Bank of America has continued to build underlying shareholder equity even during a choppy operating backdrop.
Recent company updates in 2026 have continued to emphasize digital engagement, disciplined expense management, and business growth across consumer, wealth, and corporate banking. None of these are one-time breakthroughs, but together they reinforce the case that the company is trying to widen operating leverage from a very large installed customer base.
Risks
This article is for informational purposes only and does not constitute financial advice. Some content is AI-generated. See Disclaimer


