Stock Analysis · American Express Company (AXP)
Overview
American Express Company is a global payments and lending company best known for its charge cards, credit cards, and merchant network. Unlike many card brands that only process transactions, American Express operates a more integrated model: it issues cards directly to many customers, signs up merchants to accept those cards, processes payments through its network, and earns interest from cardholders who carry balances. That combination gives the company visibility across both spending activity and credit performance.
Its business is centered on consumers, small businesses, and corporate customers, with a particularly strong focus on higher-income cardholders and travel- and service-oriented spending. The brand has long been associated with premium cards, rewards programs, travel benefits, and customer service. In practice, this means American Express is not simply a lender or a payment processor; it is a financial platform that earns money from card usage, financing, and merchant relationships.
Based on recent annual reporting, American Express generates revenue from a few main streams. Approximate shares can shift somewhat from year to year, but the overall structure is fairly consistent:
- Discount revenue: about 45% to 50% — fees charged to merchants when cardmembers use American Express cards.
- Net card fees: about 15% to 20% — annual card membership fees, especially from premium consumer and commercial cards.
- Interest on loans: about 20% to 25% — interest income from revolving credit card balances and other lending products.
- Processed revenue and other fees: about 5% to 10% — service fees, transaction processing, travel-related services, and other smaller items.
- Other revenue: low single-digit share — miscellaneous operating income not large enough to drive the overall picture on its own.
This mix matters because it makes American Express less dependent on just one source of earnings. Spending volume supports merchant fees, premium positioning supports card fees, and lending supports interest income. Over the last several years, revenue has expanded strongly, while operating income and net income have also increased, showing that growth has not come only from adding volume but also from scaling the model.
The business has become materially larger since 2021, with revenue rising from roughly the mid-$40 billion range to above $80 billion by 2025. Profit has also climbed, although interest expense has grown as rates increased and as lending balances expanded. Even so, the company has maintained solid earnings conversion, which helps explain why the market continues to value it well above most financial peers.
Key Figures
| Metric | Value | Sector ⓘ |
|---|---|---|
| Date | Oct 03, 2026 | |
| Context | ||
| Sector | Financial Services | |
| Industry | Credit Services | |
| Market Cap ⓘ | $205.36B | |
| Beta ⓘ | 1.05 | |
Value (Cheapness) | ||
| P/E Ratio ⓘ | 18.52 | 12.60 |
| P/B Ratio ⓘ | 5.97 | 1.23 |
| FCF Yield ⓘ | 7.33% | 10.16% |
| Dividend Yield ⓘ | 1.16% | 2.96% |
| EBIT / EV ⓘ | 10.45% | 7.77% |
| PEG ⓘ | 1.22 | |
Growth (Business expansion) | ||
| Revenue Growth ⓘ | 12.80% | 9.50% |
| RPS Growth (5Y CAGR) ⓘ | 19.74% | 12.10% |
| EPS Growth (5Y CAGR) ⓘ | -2.91% | -9.45% |
| BVPS Growth (5Y CAGR) ⓘ | 14.41% | 5.01% |
| Margin Growth (5Y Trend) ⓘ | -6.91% | -4.07% |
| FCF Growth (5Y CAGR) ⓘ | 5.14% | 4.96% |
| DPS Growth (5Y CAGR) ⓘ | 15.51% | 8.79% |
Quality (Business durability) | ||
| ROIC (Latest) ⓘ | 19.09% | 9.60% |
| ROE (Latest) ⓘ | 34.12% | 13.84% |
| ROA (Latest) ⓘ | 3.78% | 1.53% |
| ROIC (5Y Median) ⓘ | 13.82% | 7.86% |
| ROE (5Y Median) ⓘ | 33.58% | 12.20% |
| ROA (5Y Median) ⓘ | 3.79% | 1.29% |
| Net Debt / EBIT (Latest) ⓘ | 0.60 | 0.91 |
| Net Debt / EBIT (5Y Median) ⓘ | 0.82 | 0.74 |
| Net Debt / EBITDA (Latest) ⓘ | 0.56 | 0.97 |
| Operating Margin (Latest) ⓘ | 27.18% | 22.12% |
| Operating Margin (5Y Median) ⓘ | 17.23% | 24.39% |
| Debt to Equity (Latest) ⓘ | 172.25% | 60.37% |
| Profit Margin (Latest) ⓘ | 16.14% | 26.62% |
| Free Cash Flow (Latest) ⓘ | $15.05B | |
Momentum (Price trend) | ||
| 3Y Return ⓘ | +109.26% | +89.23% |
| 12M Return (excl. last month) ⓘ | -1.09% | +17.35% |
| 6M Return ⓘ | +0.80% | +10.00% |
| Price vs. 200-Day MA ⓘ | -8.89% | +3.73% |
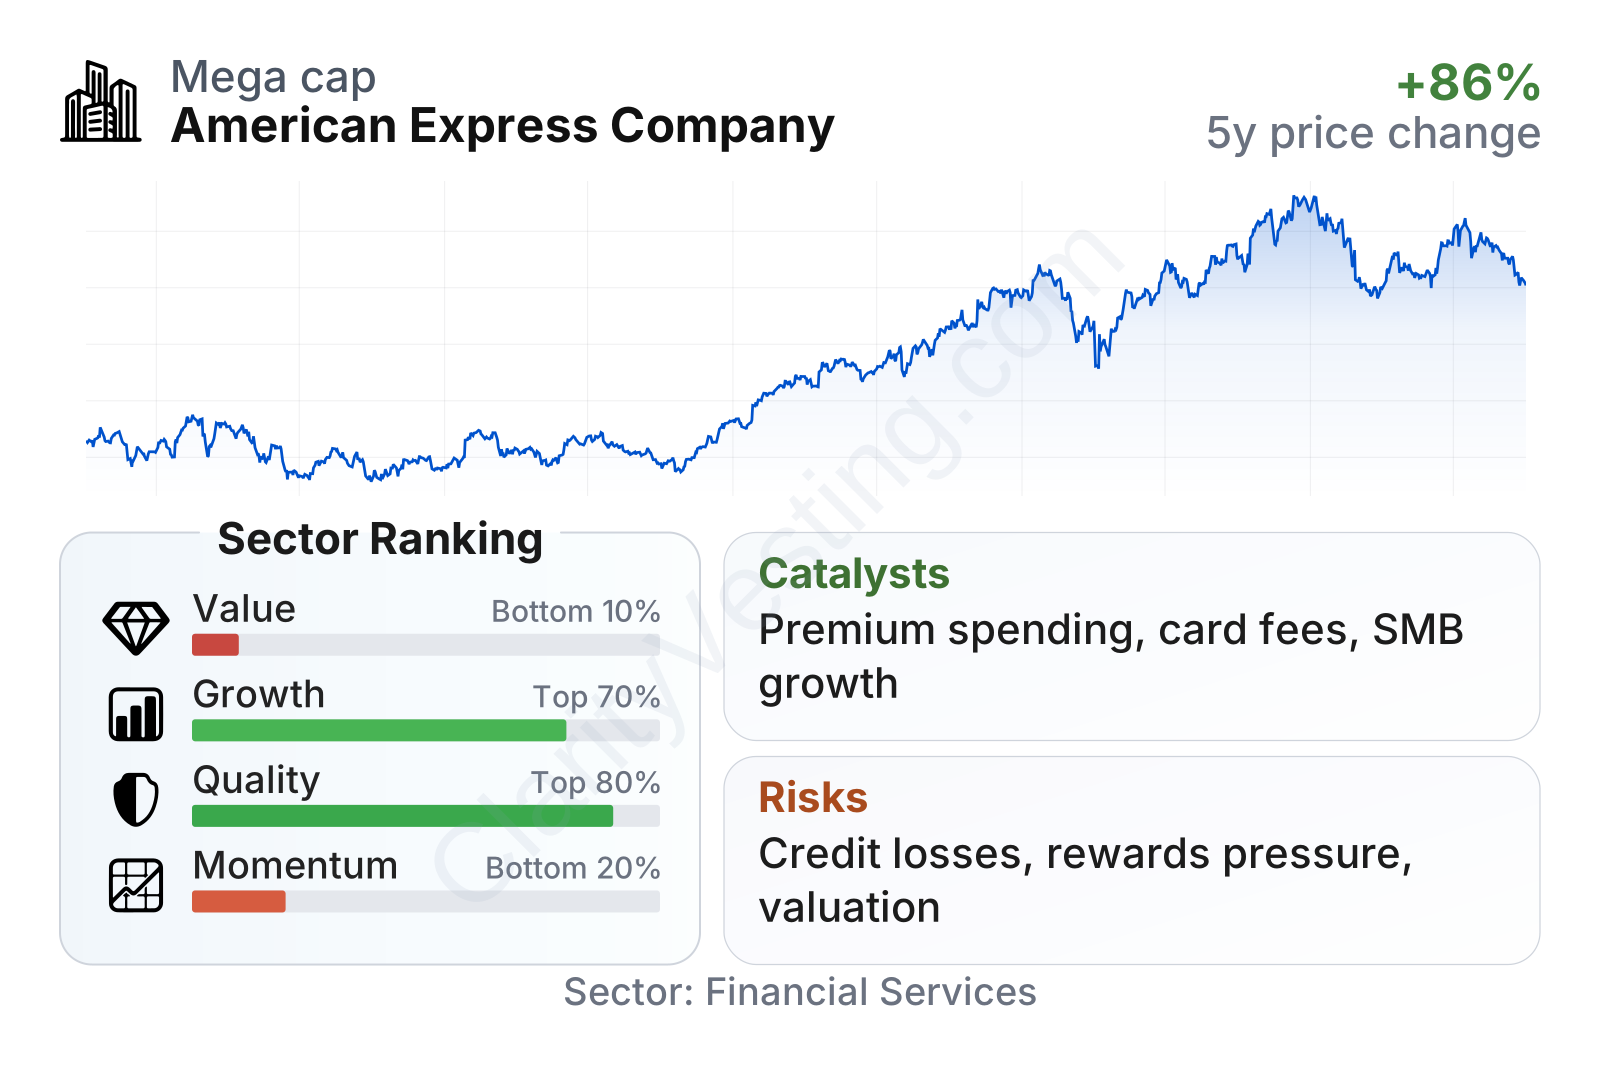
American Express is a very large financial services company with market volatility close to the broader market. The main takeaway from the latest metrics is that the company scores strongly on business quality, is respectable on growth, but looks expensive on traditional valuation measures compared with the broader financial sector. Recent share performance has also cooled relative to many sector peers after a very strong multiyear run.
Profitability remains a standout feature. Returns on capital, equity, and assets are all comfortably above sector medians, which suggests the company is not just growing, but doing so with unusually strong efficiency for a lender and payments firm. Revenue growth has also outpaced the sector median over both one-year and multi-year periods, while book value per share and dividends have compounded at healthy rates.
The weaker areas are valuation and near-term momentum. The earnings multiple is above the sector median, and the price-to-book ratio is far above most financial companies. That premium reflects the company’s brand, customer base, and profitability, but it also means expectations are not low. In addition, the share price has recently lagged sector momentum measures, which can happen when a stock has already had a large rerating and the market becomes more selective about future growth.
Growth
American Express operates in a sector with durable long-term support: digital payments continue to displace cash, card-based commerce remains deeply embedded in consumer behavior, and travel and entertainment spending still represent important categories for premium customers. On top of that, small business payments, cross-border spending, and commercial expense management remain attractive growth areas. These are not new themes, but they are still meaningful because American Express is positioned at the intersection of payments, credit, and loyalty.
The company’s strategy is coherent. Rather than competing purely on ubiquity or low pricing, it emphasizes a premium ecosystem: affluent consumers, business travelers, rewards, lounge access, merchant offers, and customer service. That creates a feedback loop. High-spending cardmembers attract merchants, merchant acceptance supports spending, and strong engagement helps justify annual fees. It is a different model from Visa and Mastercard, which are mainly networks, and different again from pure card lenders such as Discover or Capital One.
Earnings per share have moved up clearly from 2023 through 2025, following a softer 2022. That pattern suggests recent growth has not been just theoretical or based only on balance sheet expansion; it has shown up in per-share profitability. The 2026 midyear figure is only a partial-year snapshot, but it indicates earnings power remains substantial.
Book value per share has also increased steadily over the last several years. In a financial company, that is an important sign because it shows that retained earnings are building underlying equity even while the company returns capital through dividends and buybacks. Combined with strong revenue-per-share growth over five years, it points to a business that has been compounding in a meaningful way.
Recent company updates have reinforced several growth themes: continued cardmember spending, ongoing acquisition of younger consumers and small businesses, and persistent strength in premium fee-based products. The company has also continued expanding merchant coverage internationally and investing in digital capabilities, benefits, and partnerships. Those moves are significant because they support both volume growth and customer retention rather than relying only on credit expansion.
A notable catalyst is the resilience of the premium customer segment. American Express has repeatedly emphasized that its customer base tends to skew toward higher income levels, which can help spending remain firmer than in the broader market during periods of economic pressure. Another catalyst is the increasing contribution from card fees, which can make revenue somewhat more recurring and less tied to short-term loan demand.
Risks
This article is for informational purposes only and does not constitute financial advice. Some content is AI-generated. See Disclaimer


