Stock Analysis · Armstrong World Industries Inc (AWI)
Overview
Armstrong World Industries is a U.S.-based building products company focused mainly on interior ceilings and wall solutions used in offices, schools, hospitals, retail spaces, transportation hubs, and other commercial buildings. Its products are designed to improve acoustics, appearance, energy performance, and ease of installation. In simple terms, the company helps building owners and contractors finish indoor spaces with suspended ceiling systems, mineral fiber ceiling tiles, metal ceilings, architectural specialty products, and related grid systems.
The business is concentrated in commercial and institutional construction rather than residential housing. That matters because demand depends heavily on office renovations, education and healthcare spending, new non-residential construction, and repair-and-remodel activity. Armstrong also benefits from replacement demand because ceilings wear out, get redesigned, or need upgrades for acoustics, hygiene, or energy efficiency.
Based on recent company filings, Armstrong reports its operations primarily through the Mineral Fiber segment while also expanding its Architectural Specialties portfolio through acquisitions and product development. A practical way to think about the revenue mix is:
- Mineral fiber ceilings and suspension systems: about 75% to 85% of revenue. This includes ceiling tiles, panels, and the grid systems that hold them in place, mainly for commercial interiors.
- Architectural specialties: about 15% to 25% of revenue. This includes metal ceilings, felt and wood solutions, walls, partitions, and custom architectural products aimed at higher-value projects.
- Geographic mix: the large majority comes from the Americas, especially the United States, with a smaller contribution from select international markets and project exports.
Over the last several years, the company has steadily increased revenue while widening profit generation, showing that pricing, mix, and efficiency have supported more than just simple volume growth. Gross profit and operating income have risen faster than revenue, which points to a business with strong discipline and product positioning.
The operating picture has improved meaningfully since 2021: revenue has climbed from a little above $1.1 billion to more than $1.6 billion by 2025, while net income has moved from roughly $185 million to above $300 million. That is a strong sign of operating leverage in a niche building products business.
Key Figures
| Metric | Value | Sector ⓘ |
|---|---|---|
| Date | Oct 03, 2026 | |
| Context | ||
| Sector | Industrials | |
| Industry | Building Products & Equipment | |
| Market Cap ⓘ | $6.89B | |
| Beta ⓘ | 1.16 | |
Value (Cheapness) | ||
| P/E Ratio ⓘ | 22.34 | 22.45 |
| P/B Ratio ⓘ | 7.82 | 1.98 |
| FCF Yield ⓘ | 3.71% | 6.31% |
| Dividend Yield ⓘ | 0.82% | 1.96% |
| EBIT / EV ⓘ | 5.49% | 4.81% |
| PEG ⓘ | 2.02 | |
Growth (Business expansion) | ||
| Revenue Growth ⓘ | 11.20% | 9.10% |
| RPS Growth (5Y CAGR) ⓘ | 12.63% | 7.75% |
| EPS Growth (5Y CAGR) ⓘ | -4.16% | -13.59% |
| BVPS Growth (5Y CAGR) ⓘ | 17.47% | 6.22% |
| Margin Growth (5Y Trend) ⓘ | 1.96% | 0.72% |
| FCF Growth (5Y CAGR) ⓘ | 23.03% | 10.98% |
| DPS Growth (5Y CAGR) ⓘ | 10.01% | 9.48% |
Quality (Business durability) | ||
| ROIC (Latest) ⓘ | 23.46% | 10.92% |
| ROA (Latest) ⓘ | 16.17% | 5.41% |
| ROIC (5Y Median) ⓘ | 21.90% | 9.21% |
| ROA (5Y Median) ⓘ | 13.32% | 4.94% |
| Net Debt / EBIT (Latest) ⓘ | 1.23 | 2.07 |
| Net Debt / EBIT (5Y Median) ⓘ | 1.65 | 2.28 |
| Net Debt / EBITDA (Latest) ⓘ | 0.85 | 1.43 |
| Net Debt / Assets ⓘ | 24.96% | 19.27% |
| EBITDA / Interest ⓘ | 18.69 | 9.53 |
| Operating Margin (Latest) ⓘ | 24.04% | 10.50% |
| Operating Margin (5Y Median) ⓘ | 26.64% | 10.27% |
| Debt to Equity (Latest) ⓘ | 65.52% | 65.48% |
| Profit Margin (Latest) ⓘ | 18.60% | 6.62% |
| Free Cash Flow (Latest) ⓘ | $255.50M | |
Momentum (Price trend) | ||
| 3Y Return ⓘ | +130.87% | +58.56% |
| 12M Return (excl. last month) ⓘ | -11.16% | +15.63% |
| 6M Return ⓘ | -1.35% | +4.19% |
| Price vs. 200-Day MA ⓘ | -5.82% | +0.93% |
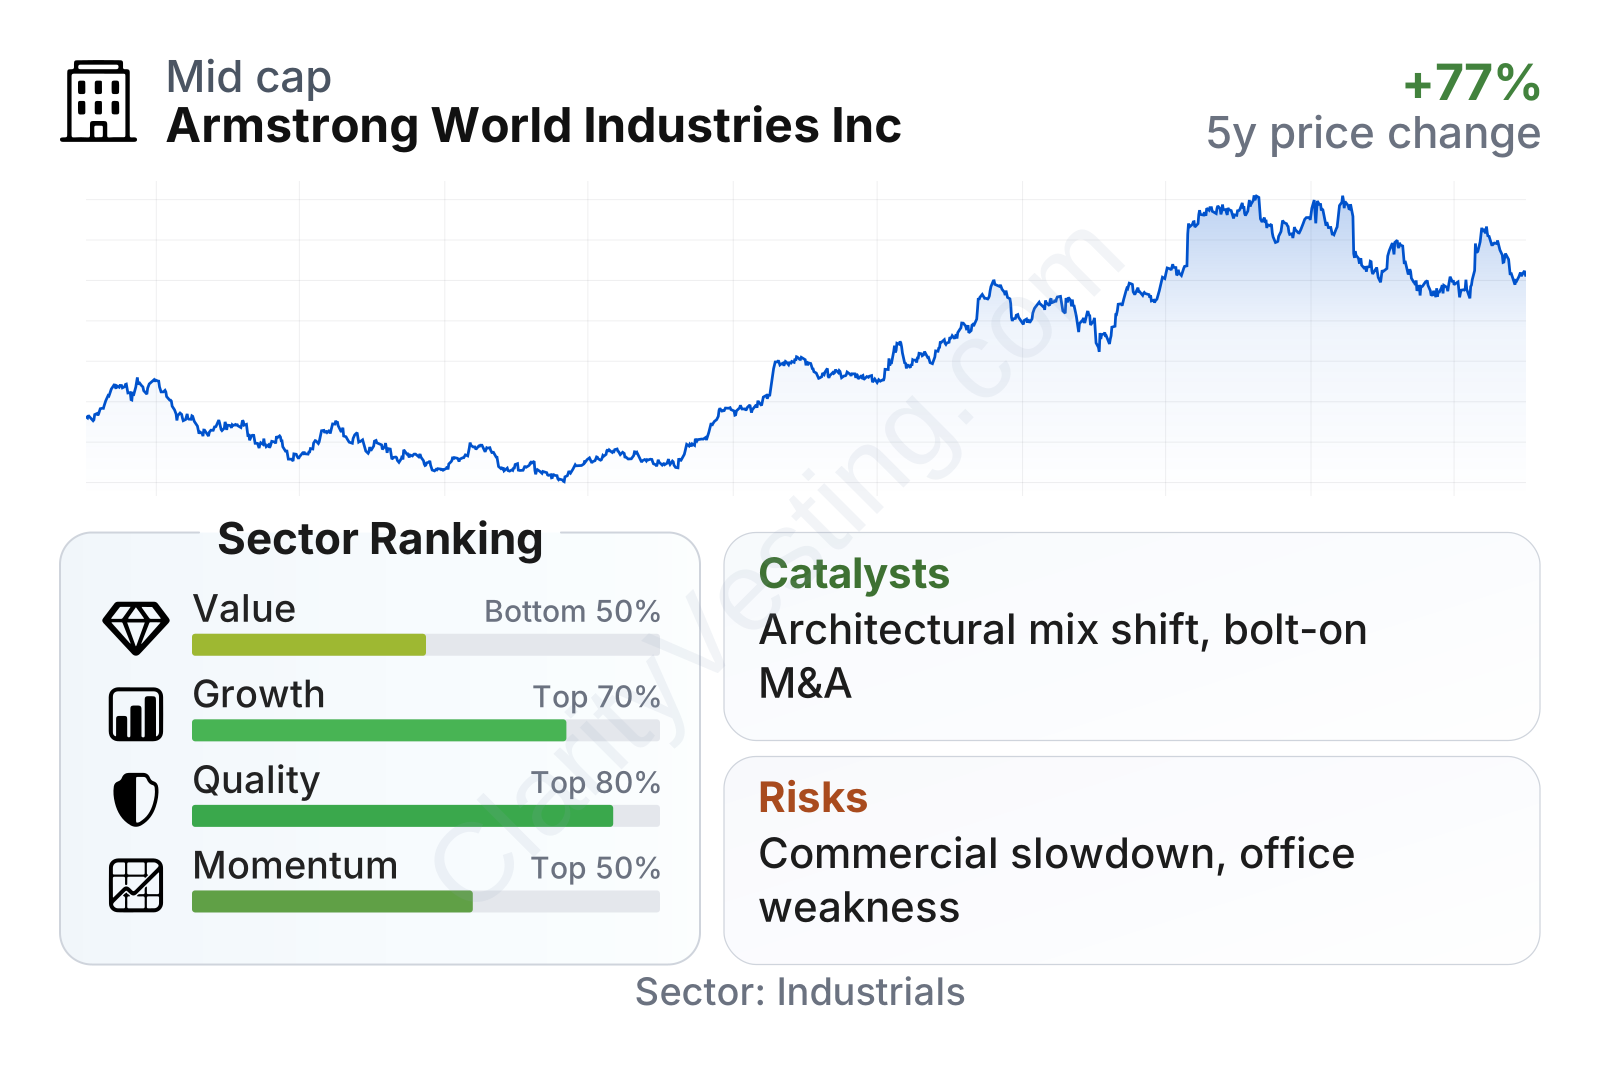
Armstrong sits in the mid-cap range and has shown strong long-term share price appreciation, although the stock has pulled back in recent months from its highs. The broader profile is notable for high quality and above-average growth versus much of the industrials universe, while valuation looks closer to average rather than deeply discounted. Profitability stands out the most: returns on capital, returns on assets, and operating margin are all well ahead of sector medians. Momentum is more mixed, reflecting a weaker short-term trading pattern despite a strong multi-year run.
Growth
Armstrong operates in a part of the market with durable long-term demand drivers rather than rapid disruption. Commercial buildings still need ceiling systems for sound control, lighting integration, air circulation, and aesthetics. Schools, healthcare facilities, and institutional buildings also require regular renovation cycles. This is not a high-growth technology field, but it can still produce steady expansion when a company has a strong installed base, pricing power, and opportunities to move customers toward premium products.
The company’s strategy appears coherent for future growth. Armstrong has been pushing further into architectural specialties, a category that tends to offer higher-value and more customized solutions than standard ceiling tiles. That can support better margins and broaden the company’s role in project design. It has also been active in acquisitions to deepen product breadth and increase exposure to attractive adjacent categories.
Revenue growth has remained positive across the recent period, though the pace has varied with construction conditions. Growth accelerated strongly through much of 2024 and 2025, then moderated but stayed positive into 2026. That pattern suggests the business has held up better than many cyclical industrial names, even as end markets have not been uniformly strong.
Cash generation is another encouraging point. Free cash flow has risen materially over the last several years, moving from a little above $100 million to nearly $250 million on a trailing basis. That matters because free cash flow gives the company flexibility for acquisitions, dividends, share repurchases, and debt management without depending on outside financing.
A meaningful catalyst is the continued mix shift toward architectural and specialty products, where design complexity and customization can make competition less price-driven. Another is non-residential renovation activity, especially in education, healthcare, and public buildings. If office demand remains uneven, these categories can still support business volume. Armstrong has also highlighted digital design tools, integrated project solutions, and contractor-focused execution as ways to strengthen specification and conversion rates.
Recent company communications have also pointed to ongoing bolt-on acquisition activity and portfolio expansion. For a company of Armstrong’s size, small and mid-sized deals can have a visible effect when they add premium categories or strengthen channel access. That does not make growth guaranteed, but it does provide a realistic path beyond basic market growth.
Risks
This article is for informational purposes only and does not constitute financial advice. Some content is AI-generated. See Disclaimer


