Stock Analysis · Aviva PLC (AVVIY)
Overview
Aviva PLC is a large U.K.-based insurance and savings group. Its business is centered on helping individuals and businesses protect assets, prepare for retirement, and invest long term. In practical terms, Aviva sells products such as life insurance, health-related protection, retirement and pension solutions, savings products, and general insurance covering homes, cars, and commercial risks. The group’s core markets are the United Kingdom, Ireland, and Canada.
Aviva’s revenue mix can look unusual compared with non-financial companies because insurers record premium income, investment-related flows, and other policyholder-related items differently. Using the company’s business structure and recent reporting, the main economic drivers can be summarized as follows:
- General insurance premiums: roughly 45% to 50% of group activity. This includes personal lines such as motor and home insurance, plus commercial insurance for businesses in the U.K., Ireland, and Canada.
- Life insurance and protection: roughly 25% to 30%. This covers life cover, health-related protection, annuities, and other long-term insurance products.
- Retirement, pensions, and savings: roughly 20% to 25%. This includes workplace pensions, retirement platforms, investment products, and wealth-related offerings.
- Other and corporate items: typically a small share. These include internal investment items, holding company effects, and smaller operations.
That mix matters because it gives Aviva a more balanced profile than a pure property-and-casualty insurer or a pure life insurer. It earns money from underwriting insurance risk, managing long-term savings, and keeping customers across multiple financial needs. The company has also spent the last several years simplifying its portfolio and concentrating on markets where it already has meaningful scale.
Profitability has been uneven in accounting terms, which is common in insurance when market movements affect reported earnings. Still, the broader picture shows a business with substantial revenue, strong cash generation, and a large installed customer base rather than a narrow single-product insurer.
The long-term pattern shows a business that has become more variable at the reported profit line than at the operating level. Revenue has expanded sharply since 2023, while operating income and net income have recovered from the 2022 setback but remain more modest than the revenue growth alone might suggest. That is a reminder that, for insurers, scale does not automatically translate into smooth bottom-line growth.
Key Figures
| Metric | Value | Sector ⓘ |
|---|---|---|
| Date | Oct 17, 2026 | |
| Context | ||
| Sector | Financial Services | |
| Industry | Insurance - Diversified | |
| Market Cap ⓘ | $27.55B | |
| Beta ⓘ | 0.64 | |
Value (Cheapness) | ||
| P/E Ratio ⓘ | 40.04 | 12.26 |
| P/B Ratio ⓘ | 3.29 | 1.23 |
| FCF Yield ⓘ | 33.27% | 10.40% |
| Dividend Yield ⓘ | 5.91% | 3.02% |
| EBIT / EV ⓘ | N/A | 8.14% |
| PEG ⓘ | 1.63 | |
Growth (Business expansion) | ||
| Revenue Growth ⓘ | 16.90% | 9.35% |
| RPS Growth (5Y CAGR) ⓘ | 42.64% | 12.19% |
| EPS Growth (5Y CAGR) ⓘ | 11.52% | -9.53% |
| BVPS Growth (5Y CAGR) ⓘ | -10.45% | 4.99% |
| Margin Growth (5Y Trend) ⓘ | -2.81% | -3.86% |
| FCF Growth (5Y CAGR) ⓘ | -1.84% | 4.81% |
| DPS Growth (5Y CAGR) ⓘ | 7.34% | 8.79% |
Quality (Business durability) | ||
| ROIC (Latest) ⓘ | N/A | 9.49% |
| ROE (Latest) ⓘ | 17.68% | 13.90% |
| ROA (Latest) ⓘ | 0.39% | 1.55% |
| ROIC (5Y Median) ⓘ | 4.08% | 7.86% |
| ROE (5Y Median) ⓘ | 10.06% | 12.17% |
| ROA (5Y Median) ⓘ | 0.28% | 1.30% |
| Net Debt / EBIT (Latest) ⓘ | N/A | 0.96 |
| Net Debt / EBIT (5Y Median) ⓘ | -5.38 | 0.73 |
| Net Debt / EBITDA (Latest) ⓘ | N/A | 0.92 |
| Operating Margin (Latest) ⓘ | N/A | 22.30% |
| Operating Margin (5Y Median) ⓘ | 5.98% | 24.63% |
| Debt to Equity (Latest) ⓘ | 68.39% | 58.56% |
| Profit Margin (Latest) ⓘ | 2.06% | 26.57% |
| Free Cash Flow (Latest) ⓘ | $9.17B | |
Momentum (Price trend) | ||
| 3Y Return ⓘ | +130.33% | +88.33% |
| 12M Return (excl. last month) ⓘ | +11.93% | +19.38% |
| 6M Return ⓘ | +10.79% | +4.75% |
| Price vs. 200-Day MA ⓘ | +9.58% | +3.50% |
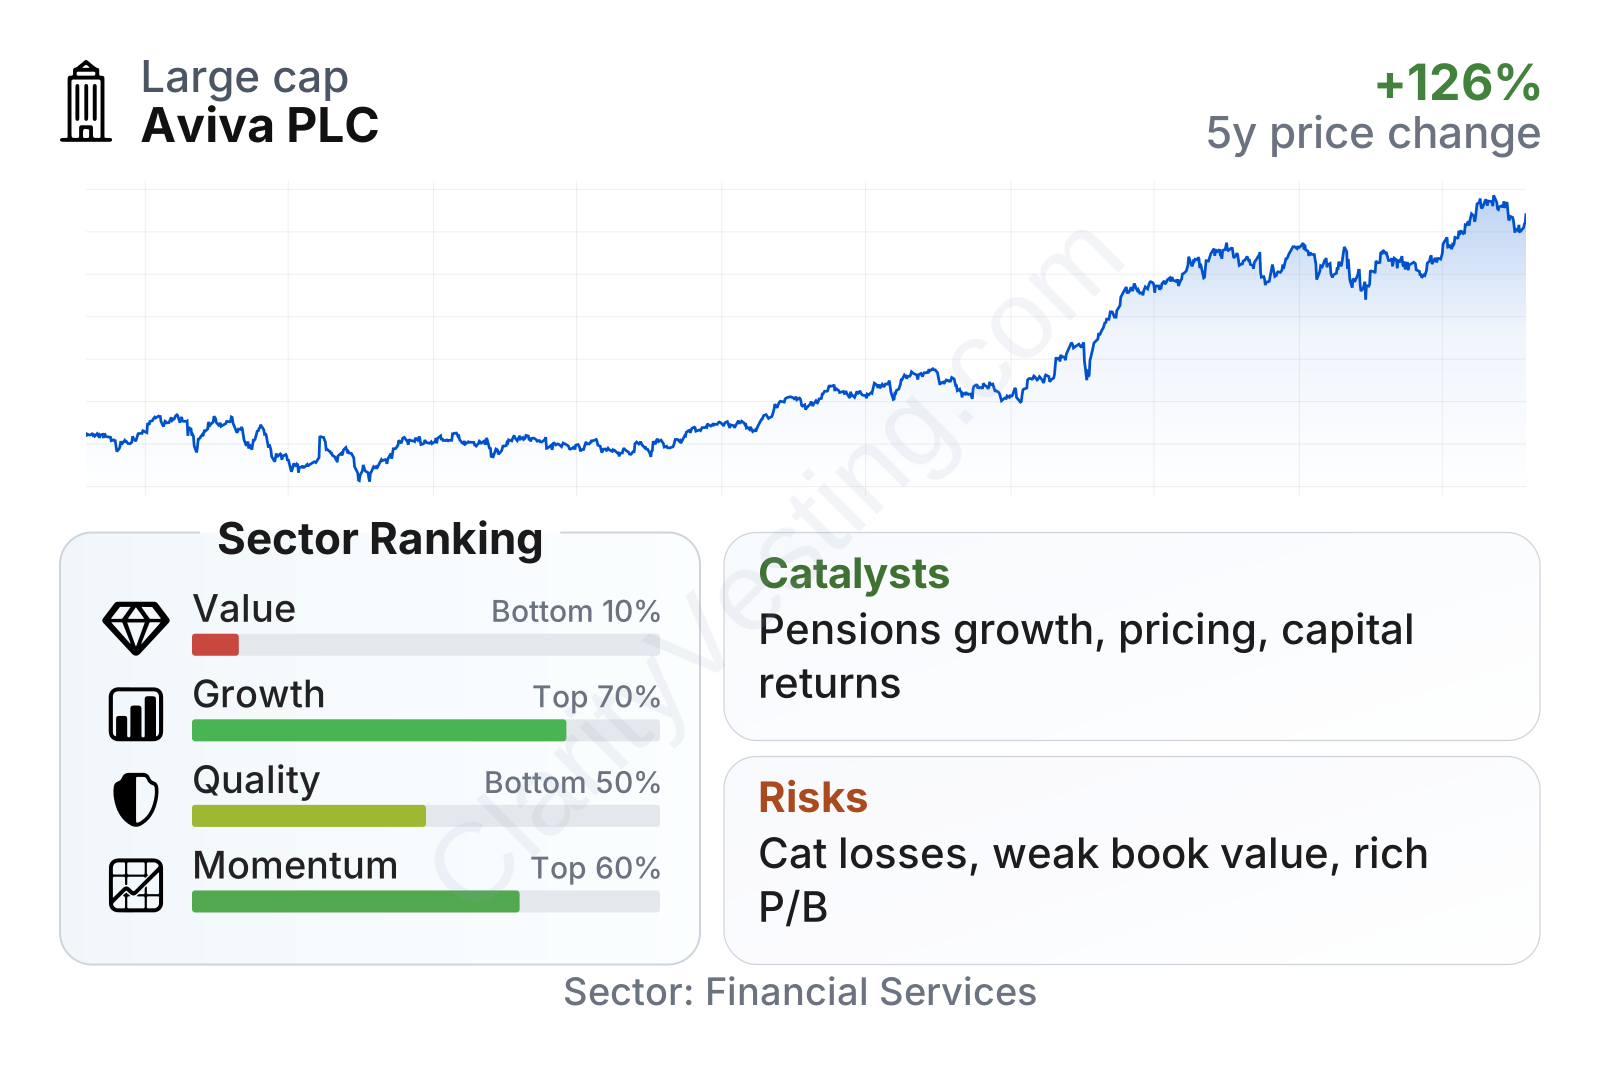
Aviva is a large insurer with a market value in the tens of billions of dollars and a relatively low beta, suggesting the shares have been less volatile than the broader market. The stock’s recent track record has been strong, with gains over three years and continued positive momentum over the last year. On income and cash metrics, the profile stands out: free cash flow yield and dividend yield are both materially above sector medians. By contrast, traditional valuation multiples such as price-to-earnings and price-to-book sit well above sector norms, which signals that the market is assigning a premium despite only mid-range overall growth and mixed quality metrics.
The quality picture is not straightforward. Return on equity is above the sector median, but profit margin, return on assets, and longer-term operating margin history look weaker. Balance-sheet leverage appears manageable in context, and cash generation is strong, yet the business does not screen as a clear sector leader on profitability efficiency.
Growth
Aviva operates in segments that should remain structurally important for many years. Insurance, retirement planning, and long-term savings benefit from aging populations, ongoing demand for retirement income, the need to protect assets, and rising pressure on households and employers to self-fund more of their future financial security. These are not fast-changing technology markets, but they are durable and supported by long-term demographic and regulatory trends.
Aviva’s strategy is broadly coherent for that environment. Management has focused on simplifying the group, building scale in its strongest geographies, and cross-selling protection, retirement, and wealth products to an existing customer base. In insurance, scale can support pricing discipline, distribution reach, and claims data advantages. In savings and pensions, it can support lower unit costs and stronger customer retention. This is especially relevant in the U.K., where workplace pensions and retirement solutions remain a large and sticky market.
Earnings per share have been volatile over the period shown, which reflects the fact that insurers can be affected by market conditions, reserve movements, and accounting noise. Even so, the broader five-year trend remains positive, with EPS compounding ahead of the sector median. That suggests underlying progress despite uneven annual reporting.
Book value per share has been less convincing. It fell materially from 2021 levels before a partial recovery, and the five-year trend is negative. For insurers, book value is an important anchor because it reflects the capital base supporting underwriting and long-term obligations. A weaker book value trend does not cancel out operational progress, but it does mean growth has not translated cleanly into steadily expanding per-share net worth.
A notable catalyst is Aviva’s ability to keep growing in capital-light areas such as pensions, wealth, and asset-light protection while maintaining pricing discipline in general insurance. Another support is shareholder distributions: strong cash generation can help fund dividends and capital returns, which can reinforce market confidence even when accounting earnings are uneven. Revenue growth has recently been stronger than the sector median, and revenue per share growth over five years has been particularly robust, pointing to meaningful business expansion rather than only financial engineering.
Recent company updates have continued to emphasize capital strength, disciplined underwriting, and expansion in core markets. For a group like Aviva, the most important opportunities tend to come less from headline-making breakthroughs and more from compounding gains in retention, pricing, workplace pensions flows, and cross-selling across its large customer base.
Risks
This article is for informational purposes only and does not constitute financial advice. Some content is AI-generated. See Disclaimer


