Stock Analysis · Austal Limited (AUTLF)
Overview
Austal Limited is a shipbuilder focused on defense and commercial vessels. The company is best known for designing, constructing, and supporting aluminum and steel ships, with major operations in Australia, the United States, and Asia. Its work is closely tied to naval procurement, especially patrol boats, high-speed support vessels, and other specialized craft used by military and government customers.
The business makes most of its money from shipbuilding contracts and related support work. Based on recent annual reporting, revenue is primarily concentrated in defense programs, with the United States being the largest market. The mix can shift from year to year depending on project timing, but the business is generally organized around these main sources:
- United States shipbuilding and defense programs: approximately 75% to 80% of revenue. This includes naval vessel construction, module fabrication, and services delivered mainly through Austal USA.
- Australian defense and commercial shipbuilding: approximately 15% to 20% of revenue. This includes patrol boats, sustainment work, and local naval programs.
- Service, support, and other international activities: approximately 5% to 10% of revenue. This includes maintenance, design support, and smaller regional contracts.
A key feature of Austal’s model is that revenue can look strong even when profitability is weak, because large shipbuilding contracts carry high material and labor costs. That pattern became especially visible in the latest fiscal year: sales rose to a record level, but margins fell sharply as contract issues and cost overruns hit earnings.
Over the last several years, the company moved from healthy profitability in 2022 to losses in 2023, then recovered in 2024 and 2025, before slipping back into a sizable loss in 2026. The main signal is not a demand problem but an execution problem: revenue has expanded, yet a much larger share is being absorbed by production costs and overhead.
Key Figures
| Metric | Value | Sector ⓘ |
|---|---|---|
| Date | Oct 03, 2026 | |
| Context | ||
| Sector | Industrials | |
| Industry | Aerospace & Defense | |
| Market Cap ⓘ | $1.25B | |
| Beta ⓘ | 0.52 | |
Value (Cheapness) | ||
| P/E Ratio ⓘ | N/A | 22.45 |
| P/B Ratio ⓘ | 1.01 | 1.98 |
| FCF Yield ⓘ | -6.29% | 6.31% |
| Dividend Yield ⓘ | N/A | 1.96% |
| EBIT / EV ⓘ | N/A | 4.81% |
| PEG ⓘ | N/A | |
Growth (Business expansion) | ||
| Revenue Growth ⓘ | -7.80% | 9.10% |
| RPS Growth (5Y CAGR) ⓘ | 5.11% | 7.75% |
| EPS Growth (5Y CAGR) ⓘ | 25.68% | -13.59% |
| BVPS Growth (5Y CAGR) ⓘ | 3.50% | 6.22% |
| Margin Growth (5Y Trend) ⓘ | -15.61% | 0.72% |
| FCF Growth (5Y CAGR) ⓘ | N/A | 10.98% |
| DPS Growth (5Y CAGR) ⓘ | -14.85% | 9.48% |
Quality (Business durability) | ||
| ROIC (Latest) ⓘ | N/A | 10.92% |
| ROA (Latest) ⓘ | 1.23% | 5.41% |
| ROIC (5Y Median) ⓘ | 2.95% | 9.21% |
| ROA (5Y Median) ⓘ | 0.74% | 4.94% |
| Net Debt / EBIT (Latest) ⓘ | N/A | 2.07 |
| Net Debt / EBIT (5Y Median) ⓘ | N/A | 2.28 |
| Net Debt / EBITDA (Latest) ⓘ | -0.17 | 1.43 |
| Net Debt / Assets ⓘ | -0.55% | 19.27% |
| EBITDA / Interest ⓘ | 2.89 | 9.53 |
| Operating Margin (Latest) ⓘ | -1.17% | 10.50% |
| Operating Margin (5Y Median) ⓘ | 4.11% | 10.27% |
| Debt to Equity (Latest) ⓘ | 23.89% | 65.48% |
| Profit Margin (Latest) ⓘ | -2.64% | 6.62% |
| Free Cash Flow (Latest) ⓘ | -$78.64M | |
Momentum (Price trend) | ||
| 3Y Return ⓘ | +155.17% | +58.56% |
| 12M Return (excl. last month) ⓘ | -40.20% | +15.63% |
| 6M Return ⓘ | -8.07% | +4.19% |
| Price vs. 200-Day MA ⓘ | -15.04% | +0.93% |
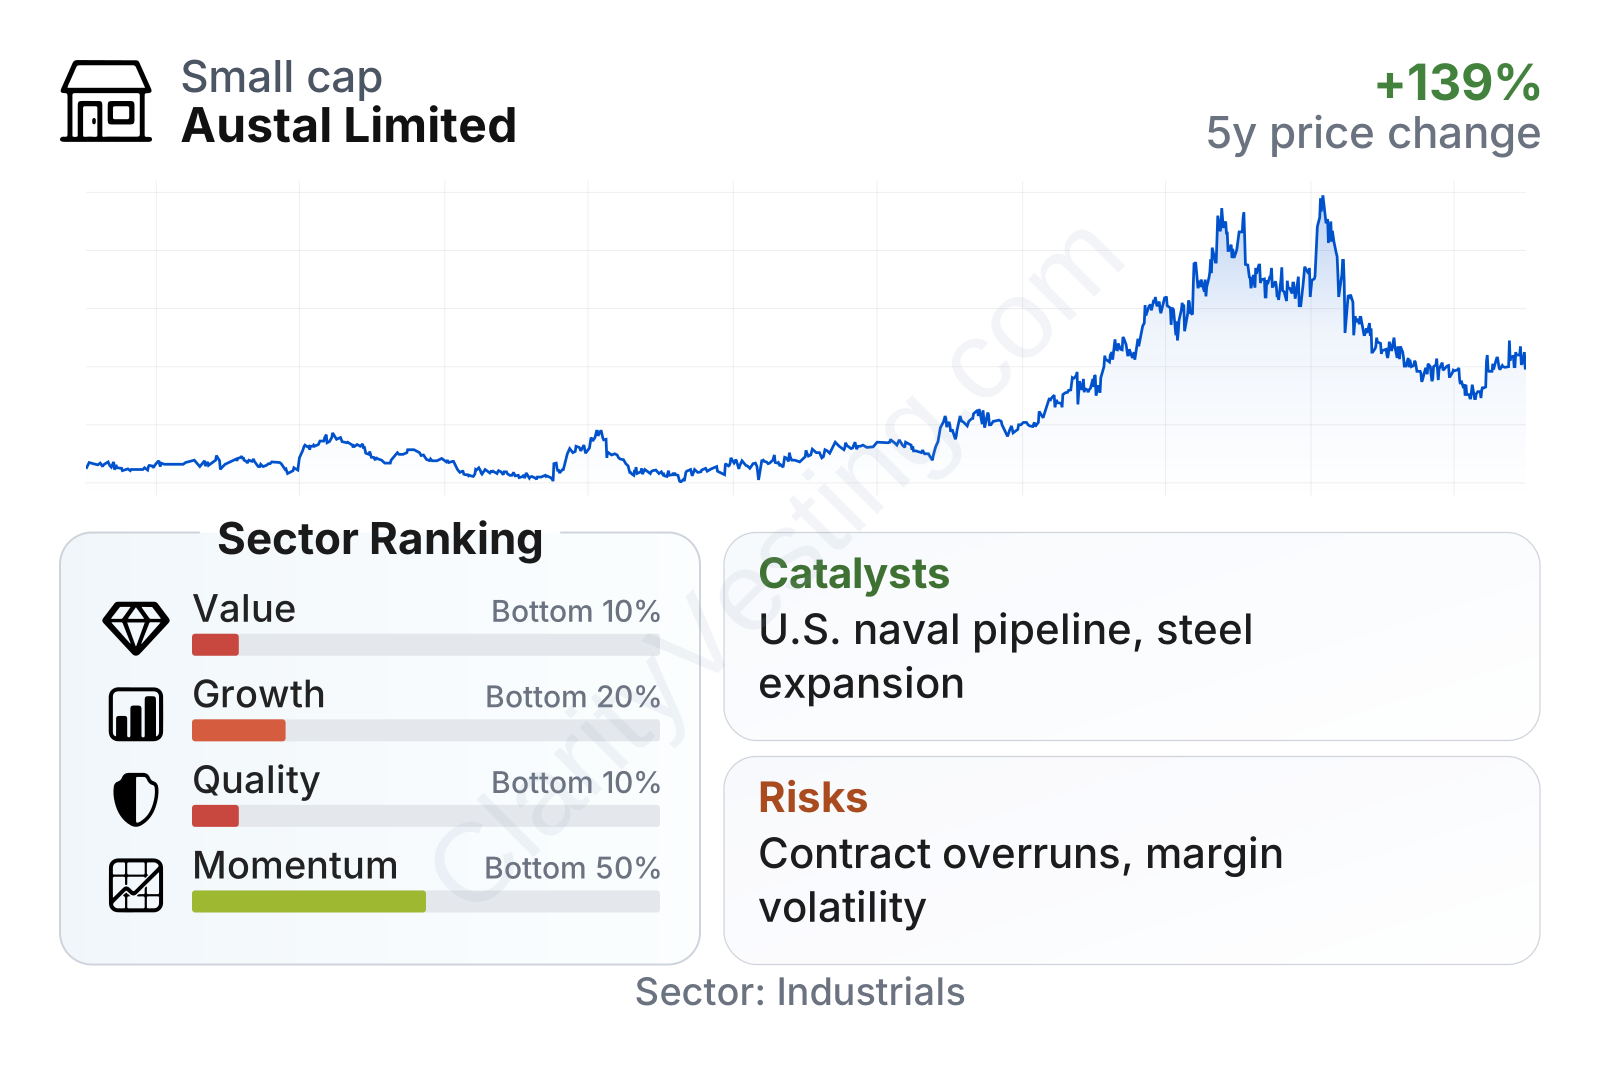
The market profile is that of a mid-sized defense manufacturer with relatively low share-price volatility, as shown by a beta well below 1. Balance-sheet leverage looks conservative compared with much of the sector, with debt equal to about 24% of equity and net cash rather than net debt on an EBITDA basis. That financial cushion matters because cash generation is currently weak: free cash flow is negative, profitability trails sector norms, and recent revenue growth has been below the industry median. Share performance has also cooled after a strong multi-year run, which suggests that enthusiasm around defense exposure has recently been tempered by concerns about execution and earnings quality.
Growth
Austal operates in a part of the market with clear long-term support. Defense shipbuilding is benefiting from higher military spending across the United States, Australia, and allied countries, particularly around maritime security, Indo-Pacific force posture, and fleet modernization. These trends do not guarantee smooth results, but they do create a favorable backdrop for companies that already have naval relationships, certified shipyards, and proven platforms.
The company’s strategy broadly makes sense for that environment. Austal has been expanding beyond its traditional aluminum niche into steel shipbuilding, submarine and surface-ship module work, and long-term support services. That matters because it can widen the addressable market and reduce dependence on a narrower set of vessel categories. Austal USA is particularly important here, as U.S. naval spending is much larger than the Australian domestic market and offers multi-year program visibility once a contractor is established.
One of the clearest catalysts is the company’s order book and pipeline tied to U.S. and Australian naval programs. Austal has continued to highlight major opportunities in defense construction and sustainment, including work connected to U.S. Navy programs and Australian patrol and support vessels. In addition, its U.S. facilities have been positioned to take on more module and auxiliary work, which could diversify revenue away from a single lead program.
Recent company reporting also points to a large workload ahead, with revenue scaling higher over the past few years. That suggests customer demand is present. The central question is whether Austal can convert that demand into stable margins. If newer steel capabilities, better project selection, and improved contract execution begin to show through, the gap between revenue growth and earnings growth could narrow meaningfully.
Risks
This article is for informational purposes only and does not constitute financial advice. Some content is AI-generated. See Disclaimer