Stock Analysis · Astronics Corp Cl B (ATROB)
Overview
Astronics Corporation is a mid-sized aerospace and defense supplier focused mainly on aircraft systems and electronics. Its products are used on commercial transport aircraft, business jets, military aircraft, and in some airport and airline operations. In simple terms, the company makes specialized equipment that helps aircraft operate, communicate, distribute power, provide lighting, and support passenger experience.
The business is organized primarily around the Aerospace segment, which is by far the core of the company. Astronics has also had a smaller Test Systems activity, but the company’s recent profile is overwhelmingly tied to aerospace electronics and aircraft-related equipment. Based on recent company filings, revenue is heavily concentrated in aerospace programs and aftermarket demand.
Main sources of revenue are approximately:
- Aerospace segment: about 95% to 100% of total revenue. This includes electrical power systems, cabin electronics, lighting, connectivity-related products, motion systems, sensors, and other components sold to aircraft manufacturers and operators.
- Test Systems and other activities: about 0% to 5% of total revenue. This area has historically included automated test equipment and related services, but it is much smaller than the aerospace business.
Within aerospace, revenue is also split between original equipment sold into new aircraft production and aftermarket sales tied to upgrades, repairs, and replacement demand. That mix matters because aftermarket business can often carry stronger margins and be less exposed to sharp swings in production schedules.
The business profile has improved meaningfully over the last few years. Revenue has climbed from roughly $445 million in 2021 to about $862 million in 2025, while profitability moved from losses to positive operating income and net income. That shift suggests Astronics is no longer just recovering from a difficult period for aviation; it is operating on a visibly stronger base.
The broad financial flow shows a notable turnaround. Sales and gross profit expanded strongly from 2021 through 2025, while interest expense eased and earnings moved from losses into profitability. The biggest operational question now is whether that improved margin structure can be sustained as the company grows.
Key Figures
| Metric | Value | Sector ⓘ |
|---|---|---|
| Date | Oct 22, 2026 | |
| Context | ||
| Sector | Industrials | |
| Industry | Aerospace & Defense | |
| Market Cap ⓘ | $2.58B | |
| Beta ⓘ | 1.25 | |
Value (Cheapness) | ||
| P/E Ratio ⓘ | 32.79 | 22.29 |
| P/B Ratio ⓘ | 14.36 | 1.98 |
| FCF Yield ⓘ | 2.38% | 6.26% |
| Dividend Yield ⓘ | N/A | 1.92% |
| EBIT / EV ⓘ | 2.82% | 4.83% |
| PEG ⓘ | 1.47 | |
Growth (Business expansion) | ||
| Revenue Growth ⓘ | 27.00% | 9.30% |
| RPS Growth (5Y CAGR) ⓘ | 11.83% | 7.76% |
| EPS Growth (5Y CAGR) ⓘ | N/A | -13.17% |
| BVPS Growth (5Y CAGR) ⓘ | -18.53% | 6.13% |
| Margin Growth (5Y Trend) ⓘ | N/A | 0.74% |
| FCF Growth (5Y CAGR) ⓘ | N/A | 10.79% |
| DPS Growth (5Y CAGR) ⓘ | N/A | 9.41% |
Quality (Business durability) | ||
| ROIC (Latest) ⓘ | 18.84% | 10.75% |
| ROA (Latest) ⓘ | 10.97% | 5.41% |
| ROIC (5Y Median) ⓘ | -6.09% | 9.37% |
| ROA (5Y Median) ⓘ | -4.16% | 4.95% |
| Net Debt / EBIT (Latest) ⓘ | 3.68 | 2.04 |
| Net Debt / EBIT (5Y Median) ⓘ | N/A | 2.27 |
| Net Debt / EBITDA (Latest) ⓘ | 2.95 | 1.39 |
| Net Debt / Assets ⓘ | 45.21% | 19.27% |
| EBITDA / Interest ⓘ | 10.62 | 9.58 |
| Operating Margin (Latest) ⓘ | 9.93% | 10.49% |
| Operating Margin (5Y Median) ⓘ | -3.82% | 10.30% |
| Debt to Equity (Latest) ⓘ | 178.07% | 64.82% |
| Profit Margin (Latest) ⓘ | 8.40% | 6.67% |
| Free Cash Flow (Latest) ⓘ | $61.42M | |
Momentum (Price trend) | ||
| 3Y Return ⓘ | +381.42% | +67.77% |
| 12M Return (excl. last month) ⓘ | +100.46% | +12.05% |
| 6M Return ⓘ | -2.11% | 0.00% |
| Price vs. 200-Day MA ⓘ | +3.01% | +0.67% |
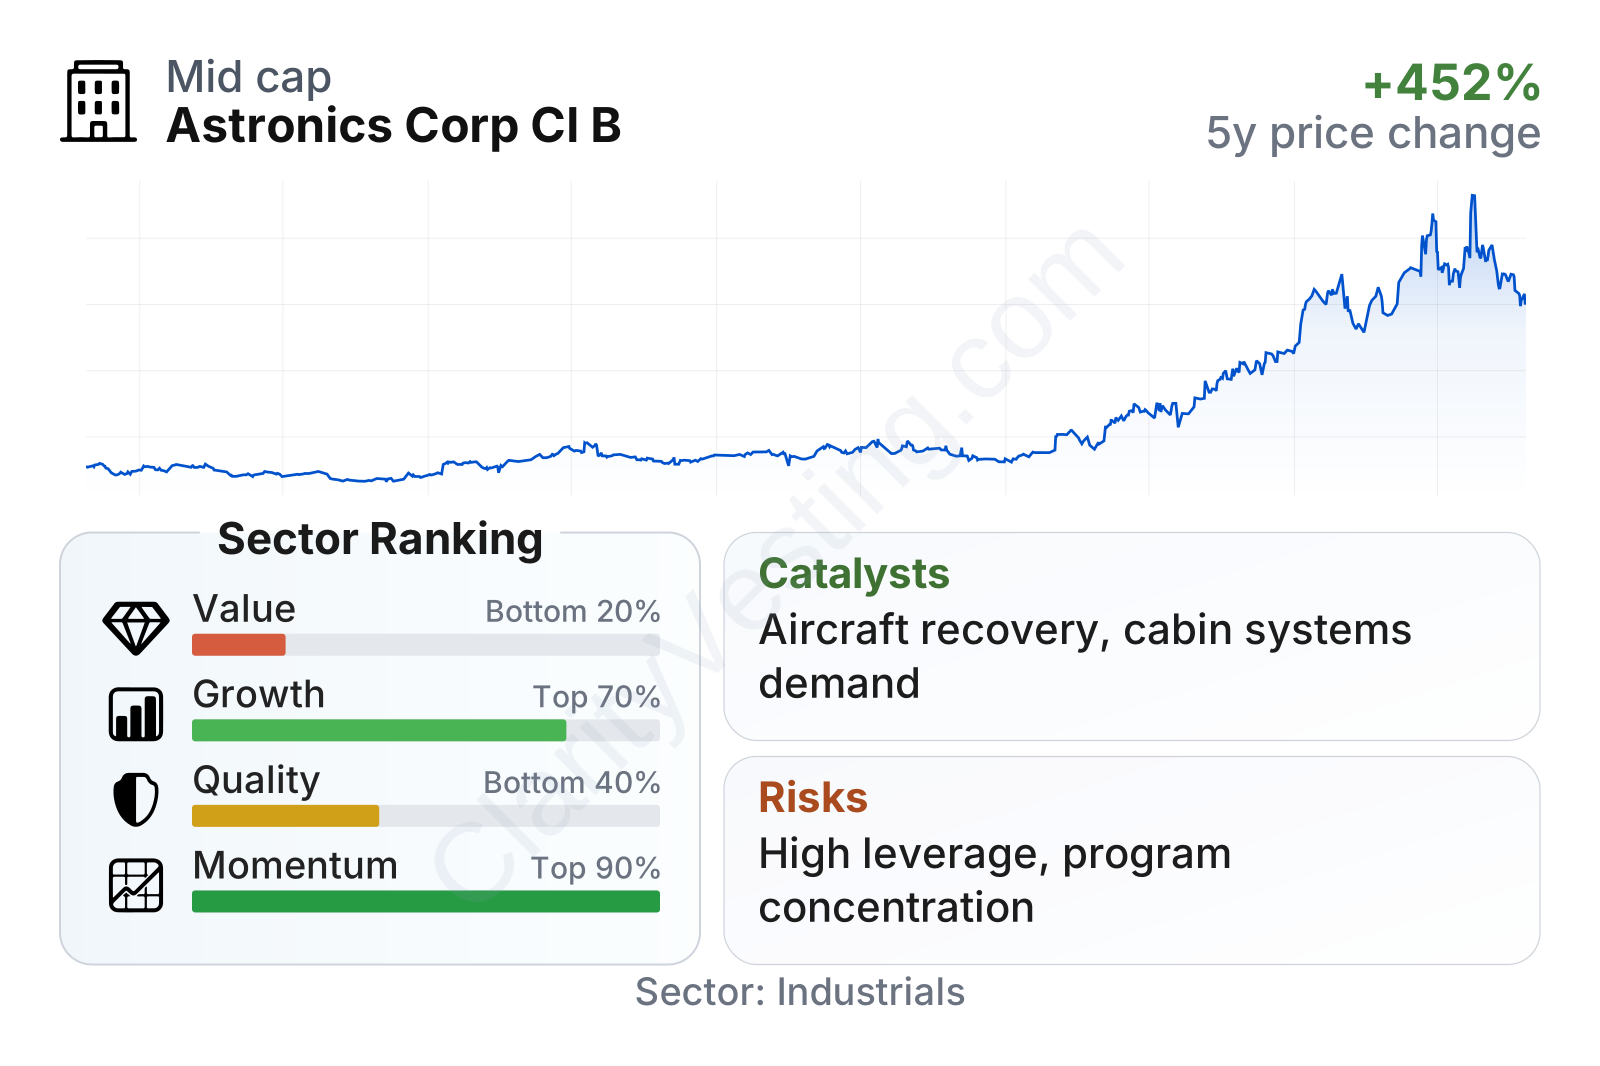
The snapshot is mixed but easy to interpret. Growth and market momentum stand out as strong, with revenue expansion clearly ahead of the sector median and the share price having rerated sharply over the last three years. Quality is more balanced: current returns on capital and assets are solid, but the longer-term record is weaker because the company only recently emerged from a stretch of losses. Value metrics look demanding, with earnings, book value, and free cash flow multiples all sitting above typical sector levels.
The stock’s past few years also show how dramatically sentiment has changed. After trading near single-digit and low-teen levels earlier in the cycle, the shares surged in 2025 and 2026 as operations improved. That kind of move usually means the market is now pricing in much more progress than it was before.
Growth
Astronics operates in a sector with favorable long-term drivers. Commercial aerospace continues to benefit from high global air traffic, airline fleet upgrades, cabin modernization, and the need for more electrical content on aircraft. Defense demand also provides another support layer, especially for specialized components and military platforms. Those trends create a reasonable backdrop for suppliers that already hold positions on established aircraft programs.
The company’s strategy appears coherent for this environment. Astronics focuses on niche systems rather than trying to compete across the whole aircraft supply chain. That can be attractive because small but mission-critical components often become deeply embedded in aircraft platforms and certification cycles. Once selected by an aircraft manufacturer, these products can remain in service for years through both production and aftermarket channels.
Recent revenue growth has been strong, although not perfectly smooth quarter to quarter. The latest year-over-year pace is around 27%, well above the sector median near 9%. That suggests Astronics is still benefiting from program ramp-ups, recovering aircraft build rates, and firm customer demand. Some earlier swings were unusually large, so future comparisons may become harder, but the overall direction remains positive.
Cash generation has also improved materially. Free cash flow was negative during the weaker part of the cycle and then turned positive as earnings recovered and operating performance strengthened. That matters for a long-term view because profitable growth is much more convincing when it begins translating into cash rather than only accounting income.
A visible catalyst is the company’s exposure to commercial aerospace production recovery and cabin electronics content. Airlines and aircraft manufacturers continue to prioritize upgrades tied to passenger power, connectivity, lighting, and electrical systems. Astronics is positioned in exactly those categories. The company has also highlighted strong bookings and backlog in recent periods, which can support revenue visibility if execution stays on track.
Another important opportunity is margin normalization. Gross profit expanded significantly between 2023 and 2025, and interest expense declined as the company moved into a healthier financial position. If operating leverage continues, earnings could potentially rise faster than revenue, which is often a powerful force in aerospace supplier recoveries.
Risks
This article is for informational purposes only and does not constitute financial advice. Some content is AI-generated. See Disclaimer


