Stock Analysis · Astronics Corporation (ATRO)
Overview
Astronics Corporation is a U.S. aerospace and defense supplier focused on specialized technology used mainly inside aircraft. Its products support how airplanes generate and manage power, how passengers use onboard systems, and how military and commercial operators equip cabins and cockpits. The company sells to aircraft manufacturers, airlines, and defense customers, with a business mix tied closely to commercial air travel, aircraft production, retrofit demand, and selected military programs.
Astronics reports through two main segments, with revenue heavily concentrated in its aerospace business.
- Aerospace: about 95% of 2025 revenue. This segment includes aircraft electrical power systems, in-seat power, lighting, aircraft structures, avionics-related equipment, connectivity support products, and testing systems used on commercial transport, business jets, and military platforms.
- Test Systems: about 5% of 2025 revenue. This segment provides automated test equipment and related support, serving aerospace, defense, and other industrial applications.
That concentration matters: Astronics is not a broad industrial conglomerate. It is primarily an aerospace supplier, so its long-term results depend much more on aircraft build rates, airline cabin upgrades, and defense program demand than on the wider economy alone.
Over the past several years, revenue has expanded materially while profitability improved from losses to positive earnings. The business flow also shows a stronger gross profit base in 2025 than in earlier years, alongside lower interest burden and a return to positive operating income. That combination suggests the recent improvement has not come from one line item alone, but from broader operating recovery.
Key Figures
| Metric | Value | Sector ⓘ |
|---|---|---|
| Date | Oct 17, 2026 | |
| Context | ||
| Sector | Industrials | |
| Industry | Aerospace & Defense | |
| Market Cap ⓘ | $2.71B | |
| Beta ⓘ | 1.25 | |
Value (Cheapness) | ||
| P/E Ratio ⓘ | 34.49 | 22.10 |
| P/B Ratio ⓘ | 14.56 | 1.97 |
| FCF Yield ⓘ | 2.26% | 6.38% |
| Dividend Yield ⓘ | N/A | 1.94% |
| EBIT / EV ⓘ | 2.82% | 4.79% |
| PEG ⓘ | 1.46 | |
Growth (Business expansion) | ||
| Revenue Growth ⓘ | 27.00% | 9.30% |
| RPS Growth (5Y CAGR) ⓘ | 11.83% | 7.81% |
| EPS Growth (5Y CAGR) ⓘ | N/A | -13.06% |
| BVPS Growth (5Y CAGR) ⓘ | -18.53% | 6.14% |
| Margin Growth (5Y Trend) ⓘ | N/A | 0.88% |
| FCF Growth (5Y CAGR) ⓘ | N/A | 11.01% |
| DPS Growth (5Y CAGR) ⓘ | N/A | 9.48% |
Quality (Business durability) | ||
| ROIC (Latest) ⓘ | 18.84% | 10.84% |
| ROA (Latest) ⓘ | 10.97% | 5.41% |
| ROIC (5Y Median) ⓘ | -6.09% | 9.38% |
| ROA (5Y Median) ⓘ | -4.16% | 4.95% |
| Net Debt / EBIT (Latest) ⓘ | 3.68 | 2.08 |
| Net Debt / EBIT (5Y Median) ⓘ | N/A | 2.27 |
| Net Debt / EBITDA (Latest) ⓘ | 2.95 | 1.39 |
| Net Debt / Assets ⓘ | 45.21% | 19.28% |
| EBITDA / Interest ⓘ | 10.62 | 9.58 |
| Operating Margin (Latest) ⓘ | 9.93% | 10.50% |
| Operating Margin (5Y Median) ⓘ | -3.82% | 10.29% |
| Debt to Equity (Latest) ⓘ | 178.07% | 65.48% |
| Profit Margin (Latest) ⓘ | 8.40% | 6.67% |
| Free Cash Flow (Latest) ⓘ | $61.42M | |
Momentum (Price trend) | ||
| 3Y Return ⓘ | +409.08% | +61.68% |
| 12M Return (excl. last month) ⓘ | +122.93% | +12.58% |
| 6M Return ⓘ | +2.20% | 0.00% |
| Price vs. 200-Day MA ⓘ | -5.27% | +0.02% |
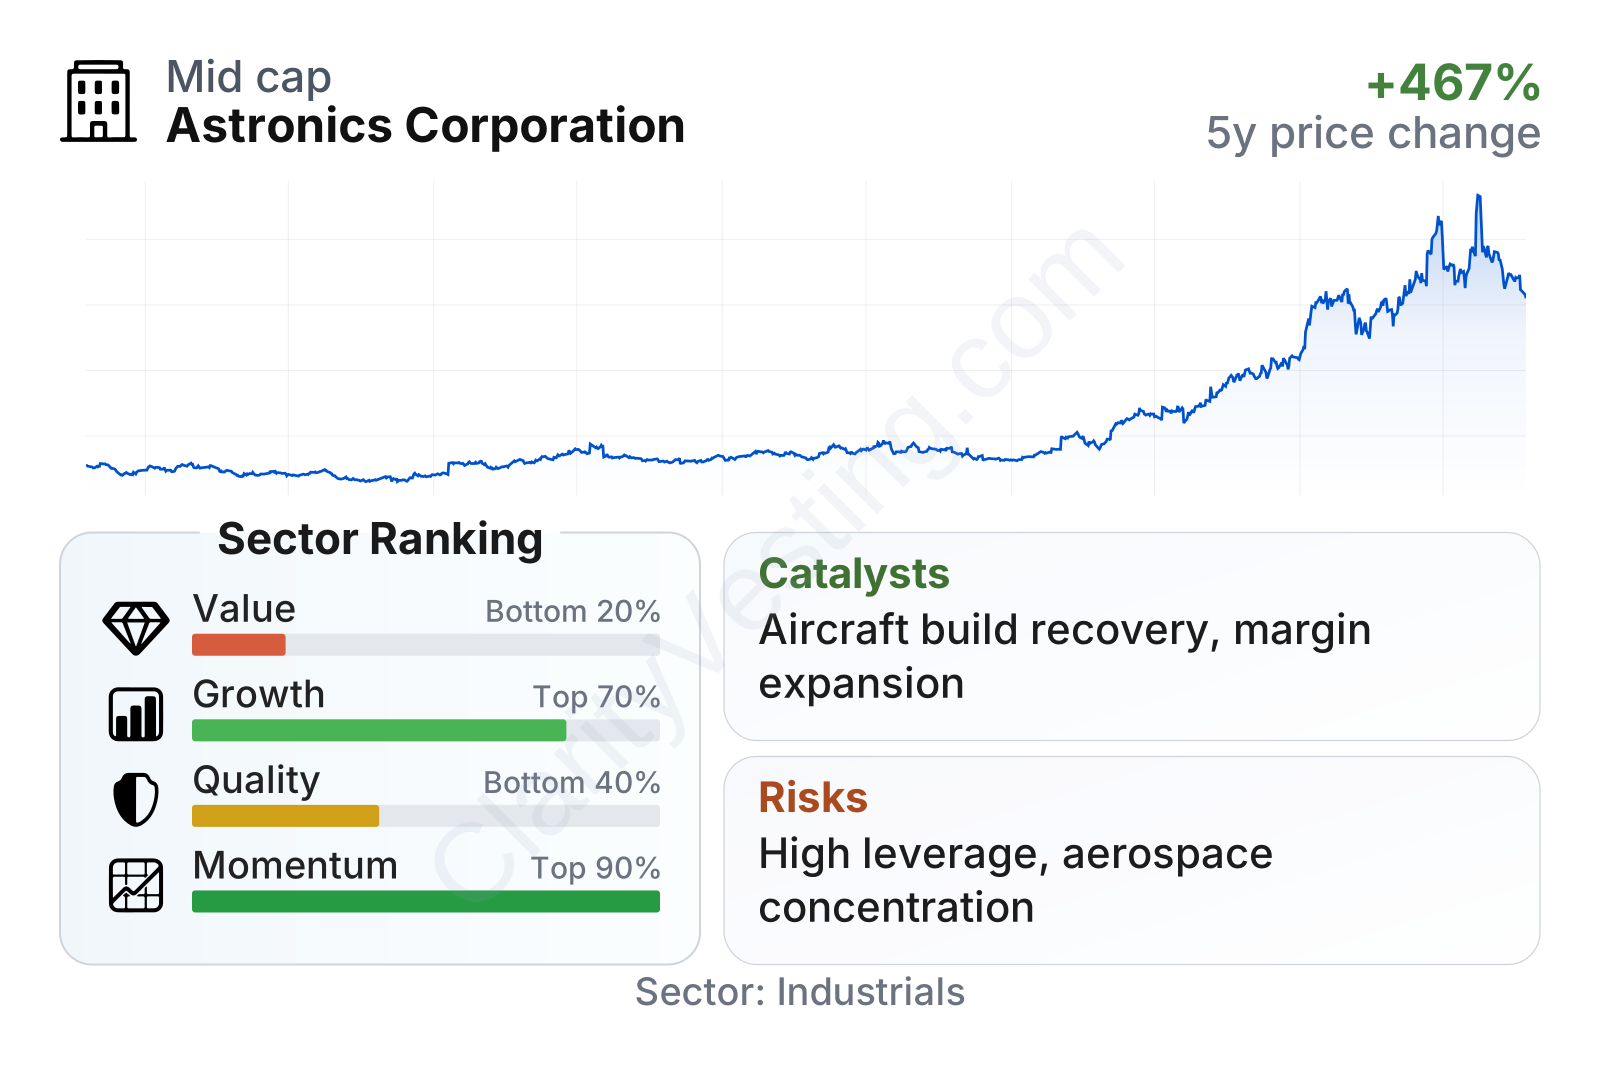
Astronics currently looks strong on market momentum and better on near-term operating quality than its longer-term record would suggest. Revenue growth is running well above the sector median, and recent returns on capital and assets are also ahead of many peers. At the same time, value metrics are weak relative to the sector, reflecting a stock that has already rerated sharply. The company remains mid-sized rather than large, and its above-average beta points to a share price that can move more than the broader market.
Growth
Astronics operates in a sector with favorable long-term drivers. Commercial aerospace continues to benefit from large aircraft backlogs, aging fleets that need cabin and systems upgrades, and ongoing demand for passenger-facing power and connectivity. Defense demand can also support selected product lines, especially where the company has specialized electrical and test capabilities.
The company’s strategy is logical for this environment. Rather than competing across the entire aircraft value chain, Astronics focuses on narrower systems where certification, reliability, and installed positions can matter. That is often a sensible place to be in aerospace because once a supplier is designed into a platform, replacement is not always easy or cheap for customers.
Recent growth has been clearly stronger than the industry median, although the quarterly path has not been perfectly smooth. After very strong rebounds and one distorted period, the latest reading is again robust at roughly 27% year over year. Over a longer period, annual revenue has climbed from about $445 million in 2021 to about $862 million in 2025, showing that the company has participated meaningfully in the aerospace recovery.
Cash generation has also turned in the right direction. Free cash flow was negative in earlier periods but moved decisively positive in 2025, even though it has cooled from that peak more recently. Positive trailing free cash flow of roughly $61 million supports the view that the recovery is now extending beyond accounting earnings and into actual cash production.
One important catalyst is aircraft content growth. Products such as in-seat power, electrical power distribution, lighting, and other onboard systems can benefit from both new aircraft deliveries and retrofits of existing fleets. Another is the company’s improved earnings profile: if margin gains continue while revenue still grows faster than the sector, operating leverage could remain meaningful. A further opportunity comes from any normalization in production rates at major aircraft manufacturers, because suppliers like Astronics often benefit after bottlenecks begin to ease.
Recent company communications have also emphasized order activity and progress in aerospace programs, which fits the broader industry pattern of elevated backlog and supply chain normalization. For a company of Astronics’ size, even a few platform wins or production step-ups can have a noticeable effect on results.
Risks
This article is for informational purposes only and does not constitute financial advice. Some content is AI-generated. See Disclaimer


