Stock Analysis · ASX Limited (ASXFY)
Overview
ASX Limited operates the main securities exchange infrastructure in Australia. It runs markets where shares, derivatives, and other financial products are traded, and it also provides the post-trade plumbing that helps those transactions clear and settle. In practical terms, ASX is not just a stock exchange brand; it is a marketplace operator, a technology provider, and a core financial infrastructure company for Australia’s capital markets.
The business is largely built around recurring activity tied to listings, trading, clearing, settlement, technical connectivity, and market data. Because ASX sits at several points of the transaction chain, it can earn revenue from both market activity and the services required to support that activity.
Based on the company’s recent reporting structure, the main revenue sources are approximately the following:
- Markets: about 35% to 40% of revenue. This includes cash equities trading, derivatives and OTC markets, listing-related activity, and issuer services.
- Technology & Data: about 25% to 30% of revenue. This covers market data, technical access, connectivity, and software or platform-related services used by market participants.
- Securities & Payments: about 20% to 25% of revenue. This generally includes settlement, registry-related infrastructure, and payments-related services.
- Listings and issuer services: roughly 10% to 15% when viewed as a standalone contribution inside the broader markets ecosystem. This area includes listing fees and services provided to public companies.
One important feature of ASX is that many of these revenue streams are linked to essential market infrastructure rather than purely discretionary spending. That tends to make the business steadier than firms that rely only on trading commissions.
The broader financial flow also shows a business with very high gross profitability and strong operating economics, although earnings can be affected by financing costs and large project spending. Revenue has recovered strongly in the most recent period after a more uneven middle stretch, which supports the view that the underlying franchise remains resilient even when conditions are not ideal.
Key Figures
| Metric | Value | Sector ⓘ |
|---|---|---|
| Date | Oct 17, 2026 | |
| Context | ||
| Sector | Financial Services | |
| Industry | Financial Data & Stock Exchanges | |
| Market Cap ⓘ | $8.42B | |
| Beta ⓘ | 0.28 | |
Value (Cheapness) | ||
| P/E Ratio ⓘ | 25.39 | 12.26 |
| P/B Ratio ⓘ | 2.11 | 1.23 |
| FCF Yield ⓘ | -25.98% | 10.40% |
| Dividend Yield ⓘ | 3.40% | 3.02% |
| EBIT / EV ⓘ | N/A | 8.14% |
| PEG ⓘ | N/A | |
Growth (Business expansion) | ||
| Revenue Growth ⓘ | 14.70% | 9.35% |
| RPS Growth (5Y CAGR) ⓘ | 11.77% | 12.19% |
| EPS Growth (5Y CAGR) ⓘ | N/A | -9.53% |
| BVPS Growth (5Y CAGR) ⓘ | 1.04% | 4.99% |
| Margin Growth (5Y Trend) ⓘ | -3.84% | -3.86% |
| FCF Growth (5Y CAGR) ⓘ | N/A | 4.81% |
| DPS Growth (5Y CAGR) ⓘ | -5.69% | 8.79% |
Quality (Business durability) | ||
| ROIC (Latest) ⓘ | N/A | 9.49% |
| ROE (Latest) ⓘ | 25.45% | 13.90% |
| ROA (Latest) ⓘ | 6.36% | 1.55% |
| ROIC (5Y Median) ⓘ | 16.35% | 7.86% |
| ROE (5Y Median) ⓘ | 12.88% | 12.17% |
| ROA (5Y Median) ⓘ | 2.92% | 1.30% |
| Net Debt / EBIT (Latest) ⓘ | 3.79 | 0.96 |
| Net Debt / EBIT (5Y Median) ⓘ | -0.71 | 0.73 |
| Net Debt / EBITDA (Latest) ⓘ | 3.61 | 0.92 |
| Operating Margin (Latest) ⓘ | 101.06% | 22.30% |
| Operating Margin (5Y Median) ⓘ | 71.80% | 24.63% |
| Debt to Equity (Latest) ⓘ | 242.12% | 58.56% |
| Profit Margin (Latest) ⓘ | 38.42% | 26.57% |
| Free Cash Flow (Latest) ⓘ | -$2.19B | |
Momentum (Price trend) | ||
| 3Y Return ⓘ | +33.24% | +88.33% |
| 12M Return (excl. last month) ⓘ | -2.24% | +19.38% |
| 6M Return ⓘ | +5.06% | +4.75% |
| Price vs. 200-Day MA ⓘ | +13.89% | +3.50% |
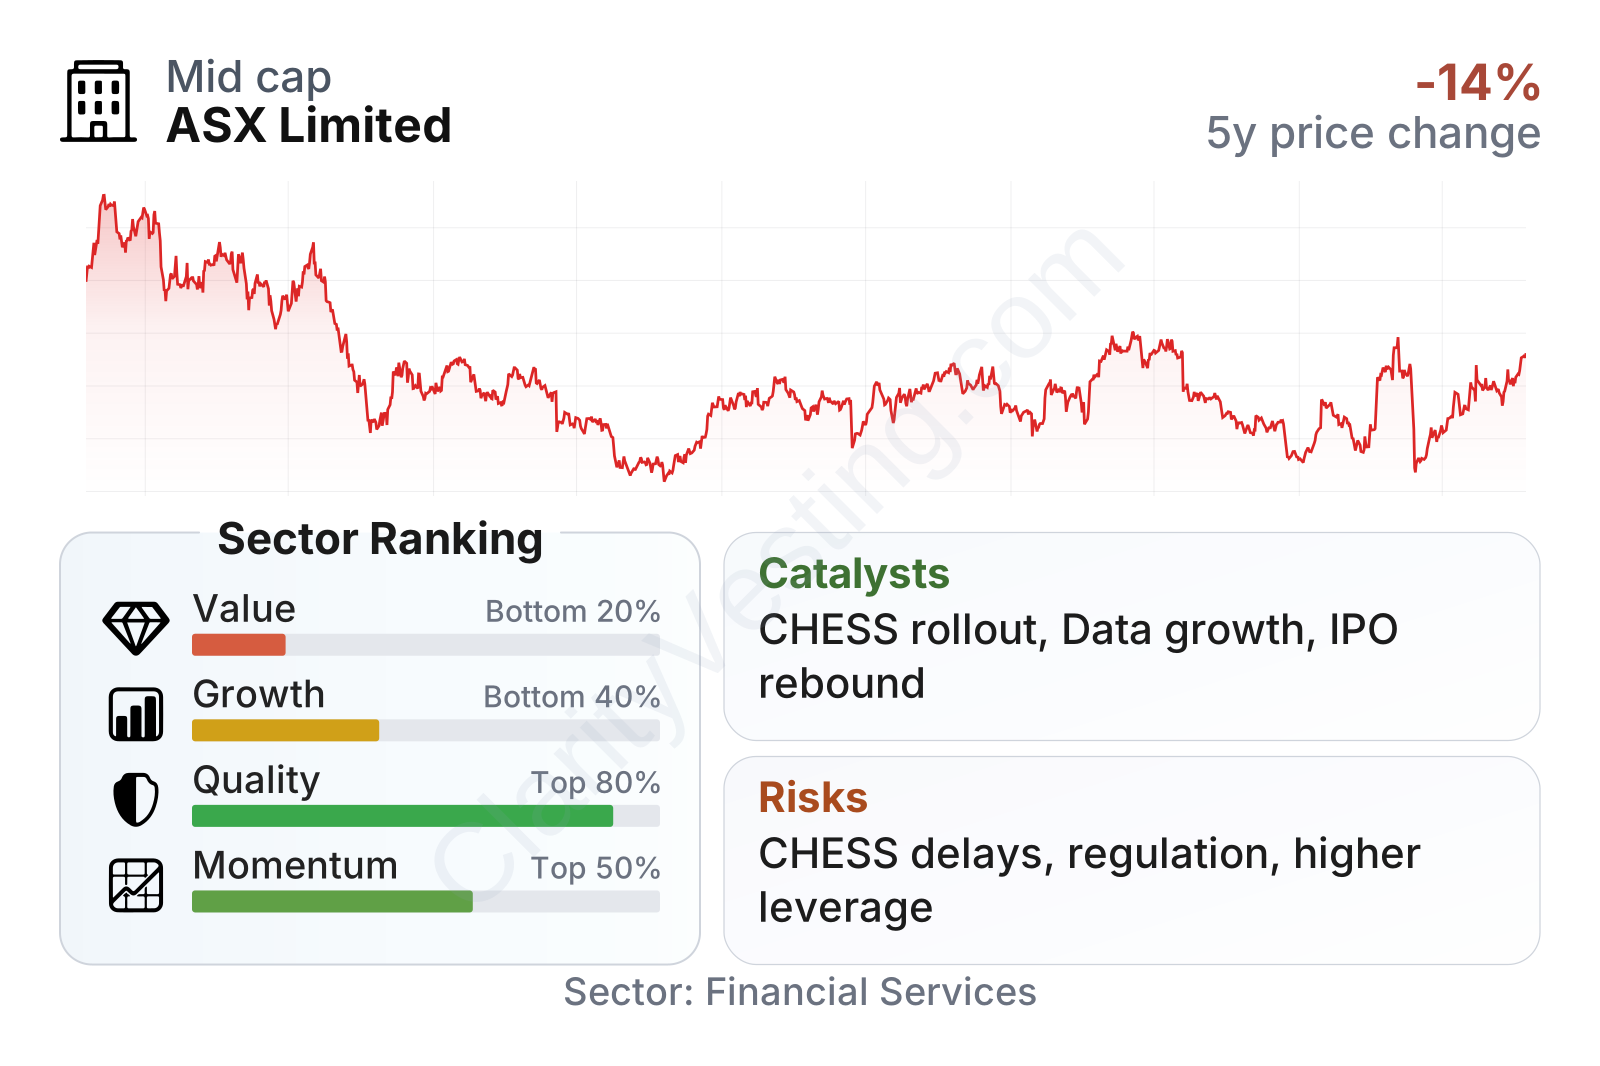
ASX is a large exchange operator with relatively low share-price volatility, reflected in a beta well below 1. The quality profile stands out more positively than the value and growth profiles. Profitability metrics are strong versus the sector, but valuation multiples are above sector medians, and free cash flow is currently under pressure. Price performance has been mixed over the last few years: weaker than the broader sector over longer periods, but more stable recently.
Growth
ASX operates in a sector that should remain relevant over the long term. Capital markets infrastructure benefits from structural trends such as rising pension savings, growing demand for transparent trading venues, greater use of data products, and continued need for clearing and settlement services. Australia also has a deep domestic retirement savings pool, which supports ongoing market participation and gives ASX a durable home-market advantage.
The company’s strategy broadly makes sense for future growth because it is centered on strengthening core market infrastructure while expanding higher-value data and technology services. For an exchange operator, this is important: trading volumes can fluctuate, but data, connectivity, and post-trade services often provide more durable and recurring revenue. That combination can support steadier growth over time than transaction revenue alone.
A major long-term catalyst is the modernization of clearing and settlement systems. After earlier execution problems, ASX has continued reshaping its approach to replace critical infrastructure in a more staged and controlled way. If the company executes well, the result could be a stronger platform, lower operational risk over time, and better ability to launch new services around collateral, clearing, and market access.
Another potential support is the continued development of Australia’s listed markets, especially if IPO activity improves from subdued levels. Exchange groups usually benefit when new listings, capital raisings, and derivatives activity recover together. That does not require a boom; even a return to more normal issuance conditions can help.
The earnings trend is less clean than the business model itself. Recent earnings per share have been uneven, which fits with the company’s period of elevated spending, project complexity, and financing costs rather than with a collapse in the underlying franchise.
Book value per share has moved up gradually over the past several years rather than accelerating sharply. That points to a company still compounding its capital base, but at a measured pace. For a mature financial infrastructure operator, moderate balance-sheet growth can still be acceptable if returns on that capital remain strong.
Recent company updates also matter. Public statements around CHESS replacement progress, regulatory engagement, and phased delivery are significant because this project has become the main operational issue attached to the equity case. Progress here is not just a technical milestone; it is central to restoring confidence in execution.
Risks
This article is for informational purposes only and does not constitute financial advice. Some content is AI-generated. See Disclaimer


