Stock Analysis · Ascentage Pharma Group International (ASPHF)
Overview
Ascentage Pharma Group International is a biotechnology company focused on cancer medicines. Its work centers on targeted therapies, especially drugs designed to block proteins that help cancer cells survive. The company’s best-known commercial product is olverembatinib, a treatment for certain blood cancers, while its broader pipeline also includes Bcl-2 and MDM2 programs aimed at different tumor types. In simple terms, Ascentage is trying to build a portfolio of precision cancer drugs that can win approvals in China and, over time, in larger international markets.
Its revenue base is still relatively concentrated and does not yet resemble a mature pharmaceutical company with diversified recurring sales. Based on public filings and company disclosures, the main sources of revenue are:
- Collaboration and licensing revenue: the largest contributor in recent periods, likely around 60% to 80% of total revenue depending on the year. This usually includes upfront payments, milestone payments, and development or commercialization agreements with partners.
- Product sales: generally around 20% to 40% of revenue, mainly linked to commercial sales of approved oncology products, especially in China.
- Other revenue: a small residual category when reported, typically tied to ancillary commercial or service-related items.
That mix matters because collaboration payments can create large jumps from one year to another, while product sales usually provide a better signal of underlying commercial traction. The business profile therefore combines elements of a development-stage biotech and an early commercial oncology company.
Operating trends also show that revenue has expanded meaningfully over the last several years, but spending on research, clinical trials, and commercialization has remained very high. Research and development has consistently absorbed a very large share of resources, which is normal for a pipeline-driven biotech but also explains why accounting losses remain substantial.
The revenue picture has become larger, but profitability has not stabilized. Spending on research remains close to or above revenue in several periods, and selling expenses rose sharply as the company pushed commercialization further. That combination shows ambition and pipeline depth, but it also means the business still depends heavily on execution and access to capital.
Key Figures
| Metric | Value | Sector ⓘ |
|---|---|---|
| Date | Oct 17, 2026 | |
| Context | ||
| Sector | Healthcare | |
| Industry | Biotechnology | |
| Market Cap ⓘ | $1.40B | |
| Beta ⓘ | 0.66 | |
Value (Cheapness) | ||
| P/E Ratio ⓘ | N/A | 24.79 |
| P/B Ratio ⓘ | 2.56 | 3.08 |
| FCF Yield ⓘ | -115.42% | 3.15% |
| Dividend Yield ⓘ | N/A | 1.94% |
| EBIT / EV ⓘ | N/A | 0.57% |
| PEG ⓘ | N/A | |
Growth (Business expansion) | ||
| Revenue Growth ⓘ | 29.30% | 7.45% |
| RPS Growth (5Y CAGR) ⓘ | 94.55% | 8.61% |
| EPS Growth (5Y CAGR) ⓘ | -60.41% | -17.81% |
| BVPS Growth (5Y CAGR) ⓘ | -6.58% | 3.72% |
| Margin Growth (5Y Trend) ⓘ | N/A | -0.62% |
| FCF Growth (5Y CAGR) ⓘ | N/A | 1.04% |
| DPS Growth (5Y CAGR) ⓘ | N/A | 6.77% |
Quality (Business durability) | ||
| ROIC (Latest) ⓘ | -60.57% | 3.24% |
| ROA (Latest) ⓘ | -71.55% | 3.01% |
| ROIC (5Y Median) ⓘ | -32.49% | 4.60% |
| ROA (5Y Median) ⓘ | -33.50% | 1.89% |
| Net Debt / EBIT (Latest) ⓘ | N/A | 1.34 |
| Net Debt / EBIT (5Y Median) ⓘ | N/A | 1.84 |
| Net Debt / EBITDA (Latest) ⓘ | N/A | 1.00 |
| Net Debt / Assets ⓘ | 6.14% | 5.45% |
| EBITDA / Interest ⓘ | N/A | 9.64 |
| Operating Margin (Latest) ⓘ | -240.85% | 9.27% |
| Operating Margin (5Y Median) ⓘ | -376.97% | 7.38% |
| Debt to Equity (Latest) ⓘ | 376.46% | 28.58% |
| Profit Margin (Latest) ⓘ | -228.54% | 3.59% |
| Free Cash Flow (Latest) ⓘ | -$1.62B | |
Momentum (Price trend) | ||
| 3Y Return ⓘ | +27.55% | +42.80% |
| 12M Return (excl. last month) ⓘ | -55.15% | +18.50% |
| 6M Return ⓘ | -55.78% | +7.57% |
| Price vs. 200-Day MA ⓘ | -41.38% | +5.12% |
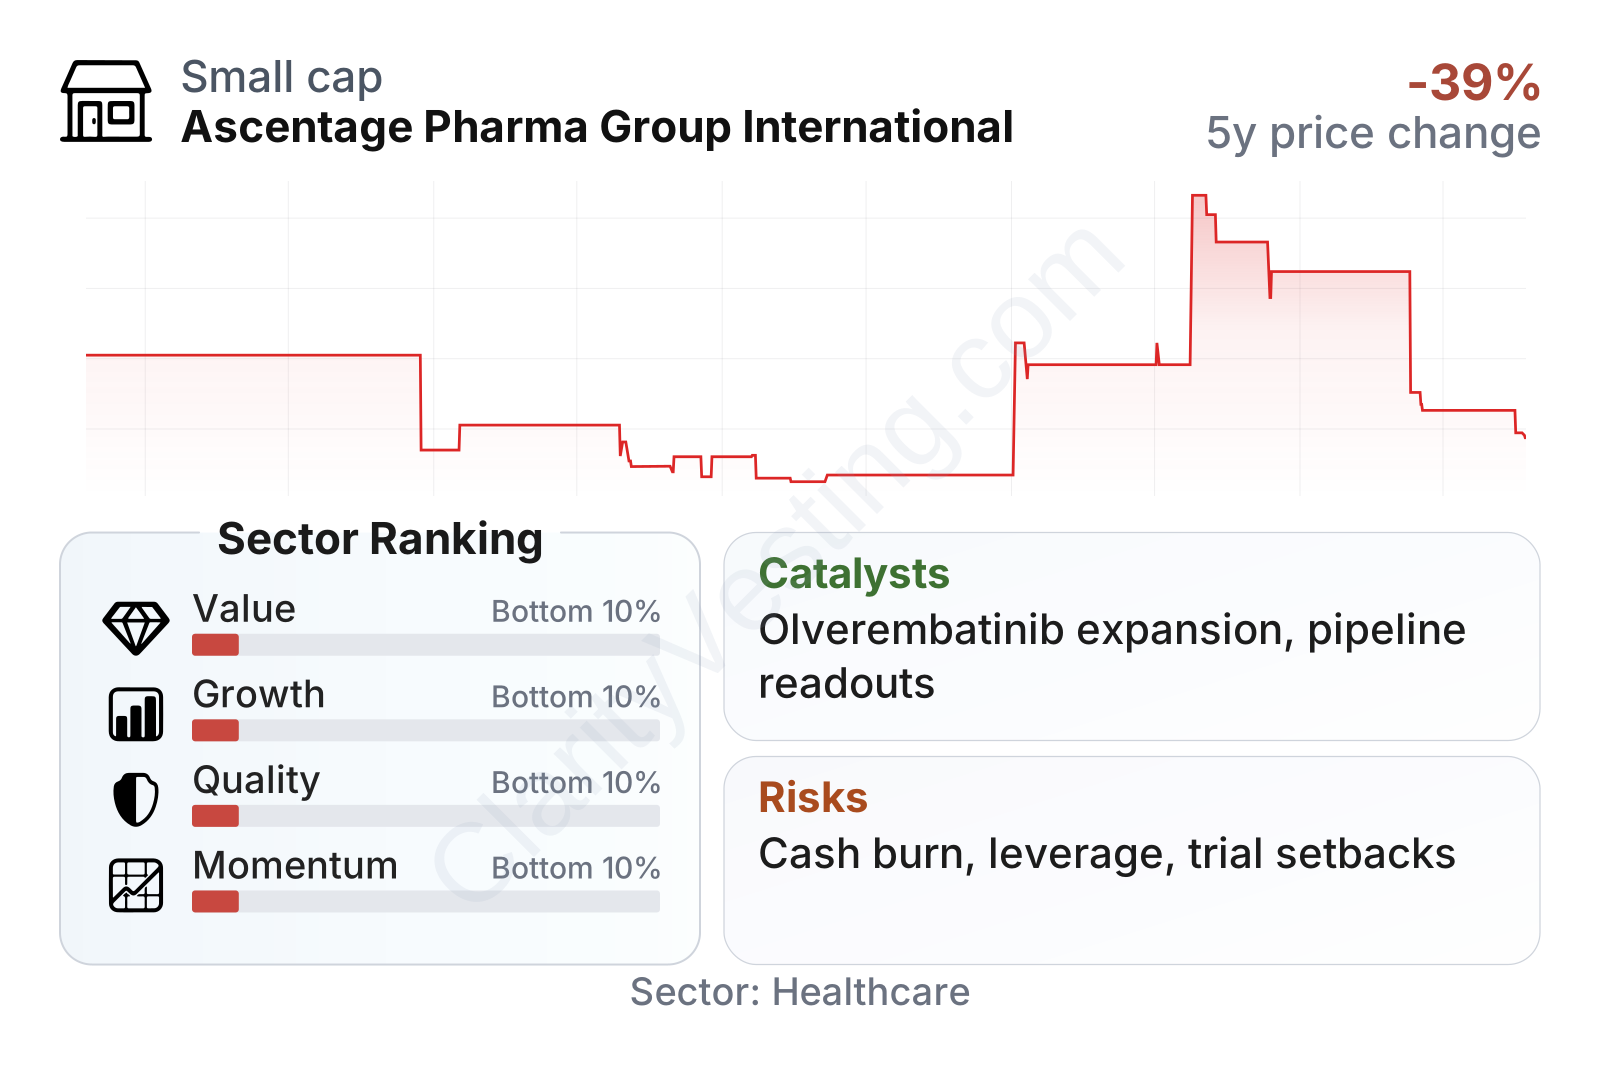
The company sits in the lower end of the healthcare peer group on value, quality, growth, and momentum factors, but for different reasons. Growth in revenue has been strong, including year-over-year expansion well above the sector median and an unusually high five-year revenue-per-share growth rate. However, these top-line gains have not translated into earnings quality. Returns on assets and invested capital remain deeply negative, margins are far below sector norms, and free cash flow is heavily negative.
The balance sheet is a mixed picture. Net debt relative to assets is not extreme at roughly 6%, but debt to equity is very high at about 376%, reflecting a capital structure that deserves close attention. Share price behavior also highlights the speculative nature of the stock: the longer-term performance has included strong rebounds, but the last 6 to 12 months have been sharply weaker, and the shares are trading materially below their longer-term average trend. With a market value around the small- to mid-cap biotech range and a beta below 1, the stock does not move exactly like the broad market, but company-specific events can still drive major swings.
Growth
Ascentage operates in one of the most active parts of healthcare: oncology and targeted cancer therapies. This is a structurally attractive area because cancer remains a major global medical need, regulators are often open to accelerated pathways for meaningful new treatments, and successful drugs can generate high value if they address hard-to-treat patient groups. Within oncology, the company’s focus on apoptosis-related targets such as Bcl-2 and on precision therapies for hematologic malignancies aligns with parts of the market that continue to attract research spending and partnership interest.
Its strategy broadly makes sense for future growth. The company is not relying on a single scientific concept only; instead, it is building around multiple oncology assets at different stages. That can create several shots on goal: more indications for existing products, additional regulatory filings, and partnering opportunities outside China. A key element of the thesis is whether olverembatinib can keep broadening its clinical and commercial reach, while the rest of the pipeline advances enough to reduce dependence on one lead asset.
Recent company developments have continued to point toward international expansion and pipeline maturation. Public updates in 2025 and 2026 highlighted progress in clinical programs and ongoing regulatory engagement for hematology and solid tumor candidates. For a biotech company of this size, meaningful catalysts usually come from three places: trial results, regulatory milestones, and licensing agreements. Ascentage has exposure to all three. If one or more late-stage programs gains broader approval or stronger overseas positioning, the company’s revenue profile could become less lumpy and more product-driven.
Another positive sign is that the company has already shown it can attract partners and monetize parts of its platform. That does not remove development risk, but it does suggest external validation of the science. In biotech, that kind of validation often matters as much as near-term profits, because it can support financing access, trial expansion, and future dealmaking.
Risks
This article is for informational purposes only and does not constitute financial advice. Some content is AI-generated. See Disclaimer


